3.2 Toolbar Buttons
You can quickly change a number of plotting parameters using buttons in the toolbar at the top of the Xynk window.
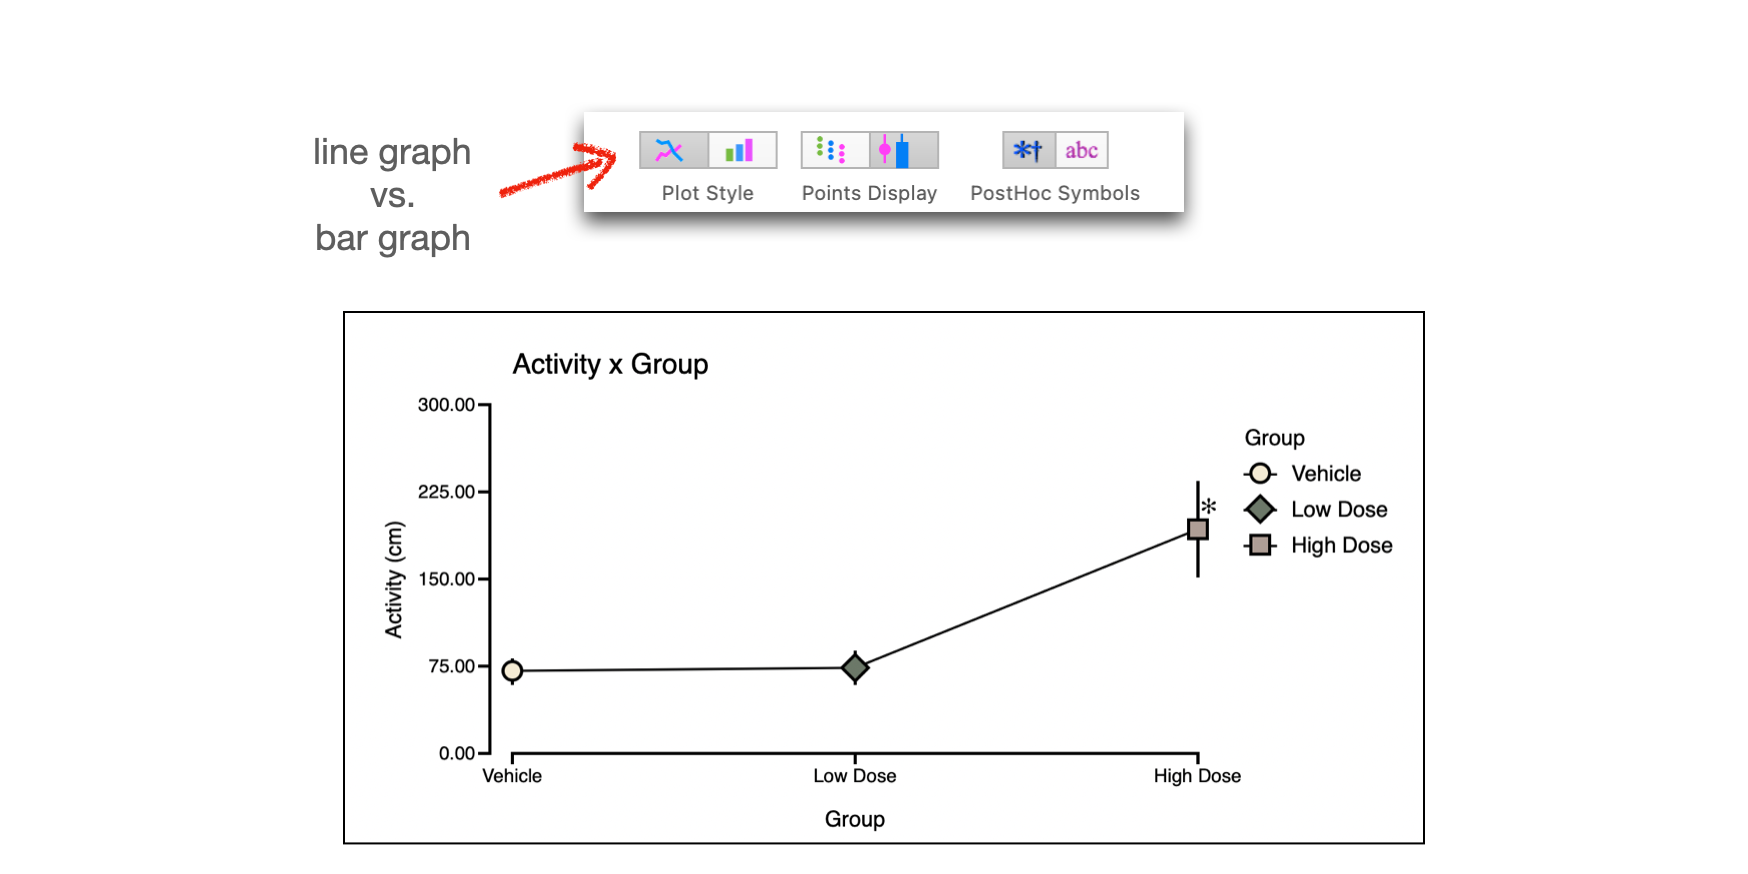
Bar vs Line Graph
Xynk opens graphs in a bar graph format by default.
You can switch between a bar graph and a line graph using the Plot Style buttons:
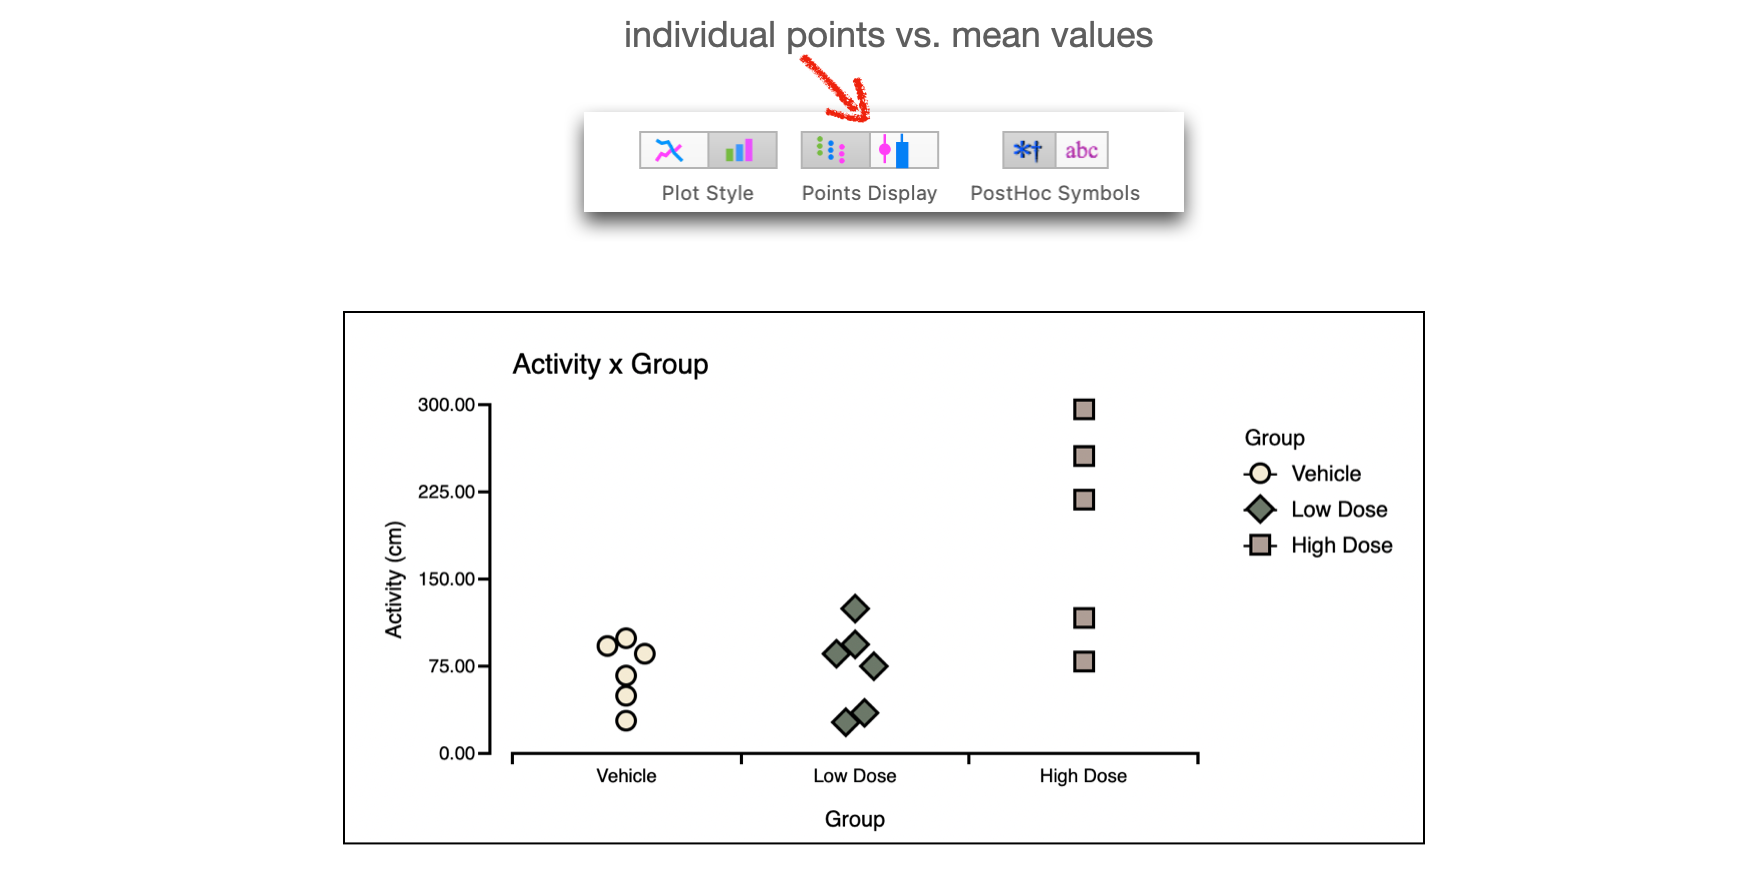
Individual Data Points
You can switch between plotting the data as a summary value ± error bars, or plotting the indiviudal data points that make up each summary value, using the Points Display button:
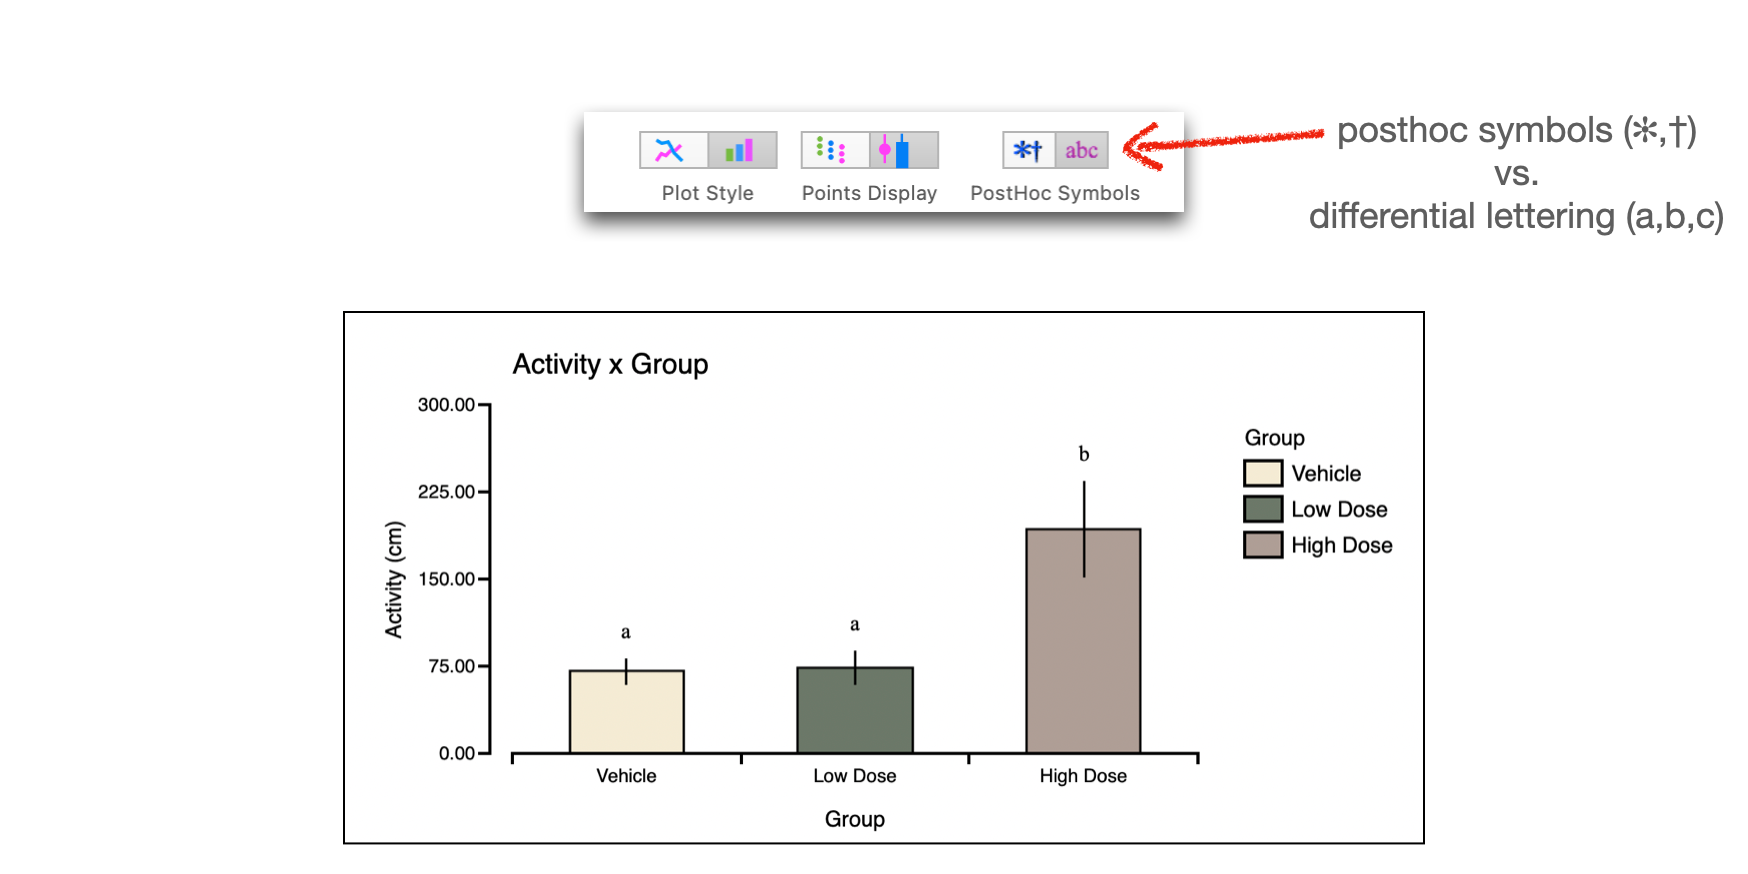
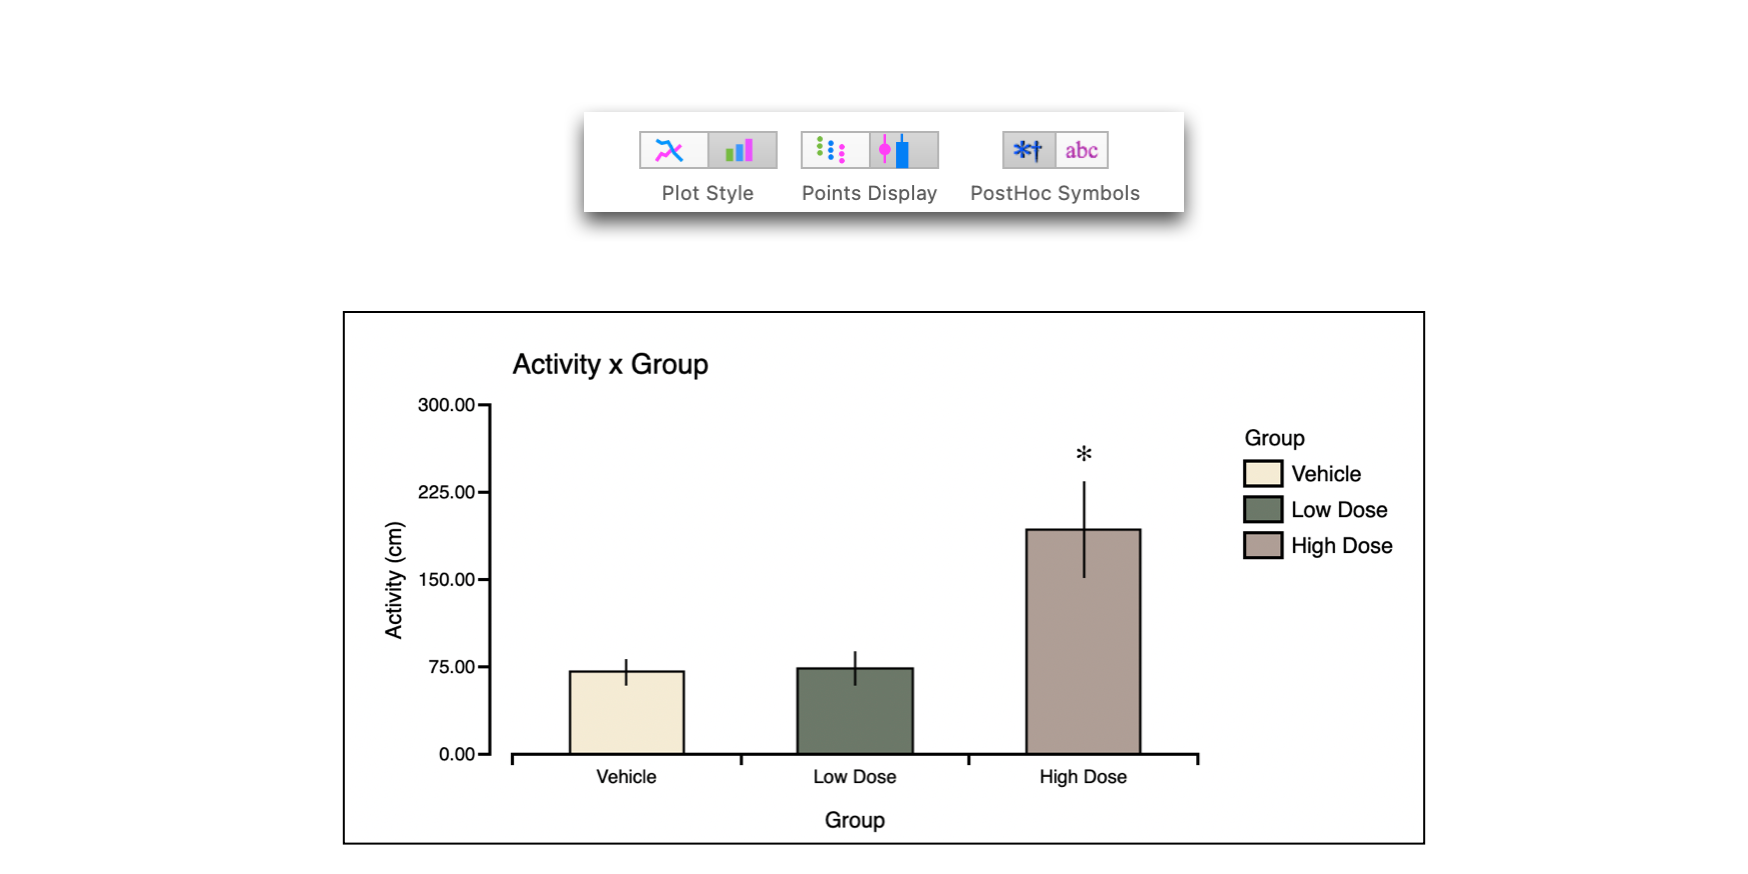
Post-hoc symbols
Significant post-hoc comparisons can be shown as either symbols (such as an asterix (*) or a dagger (†), or by showing letters (a,b,c...) next to each group, where groups with the same letter are not significantly different. (see the section on post-hoc comparisons for more on how to specify post-hoc comparisons.)
You can switch between these modes with the PostHoc Symbols button.