3.1 Parts Of A Xynk Graph
The Graph window
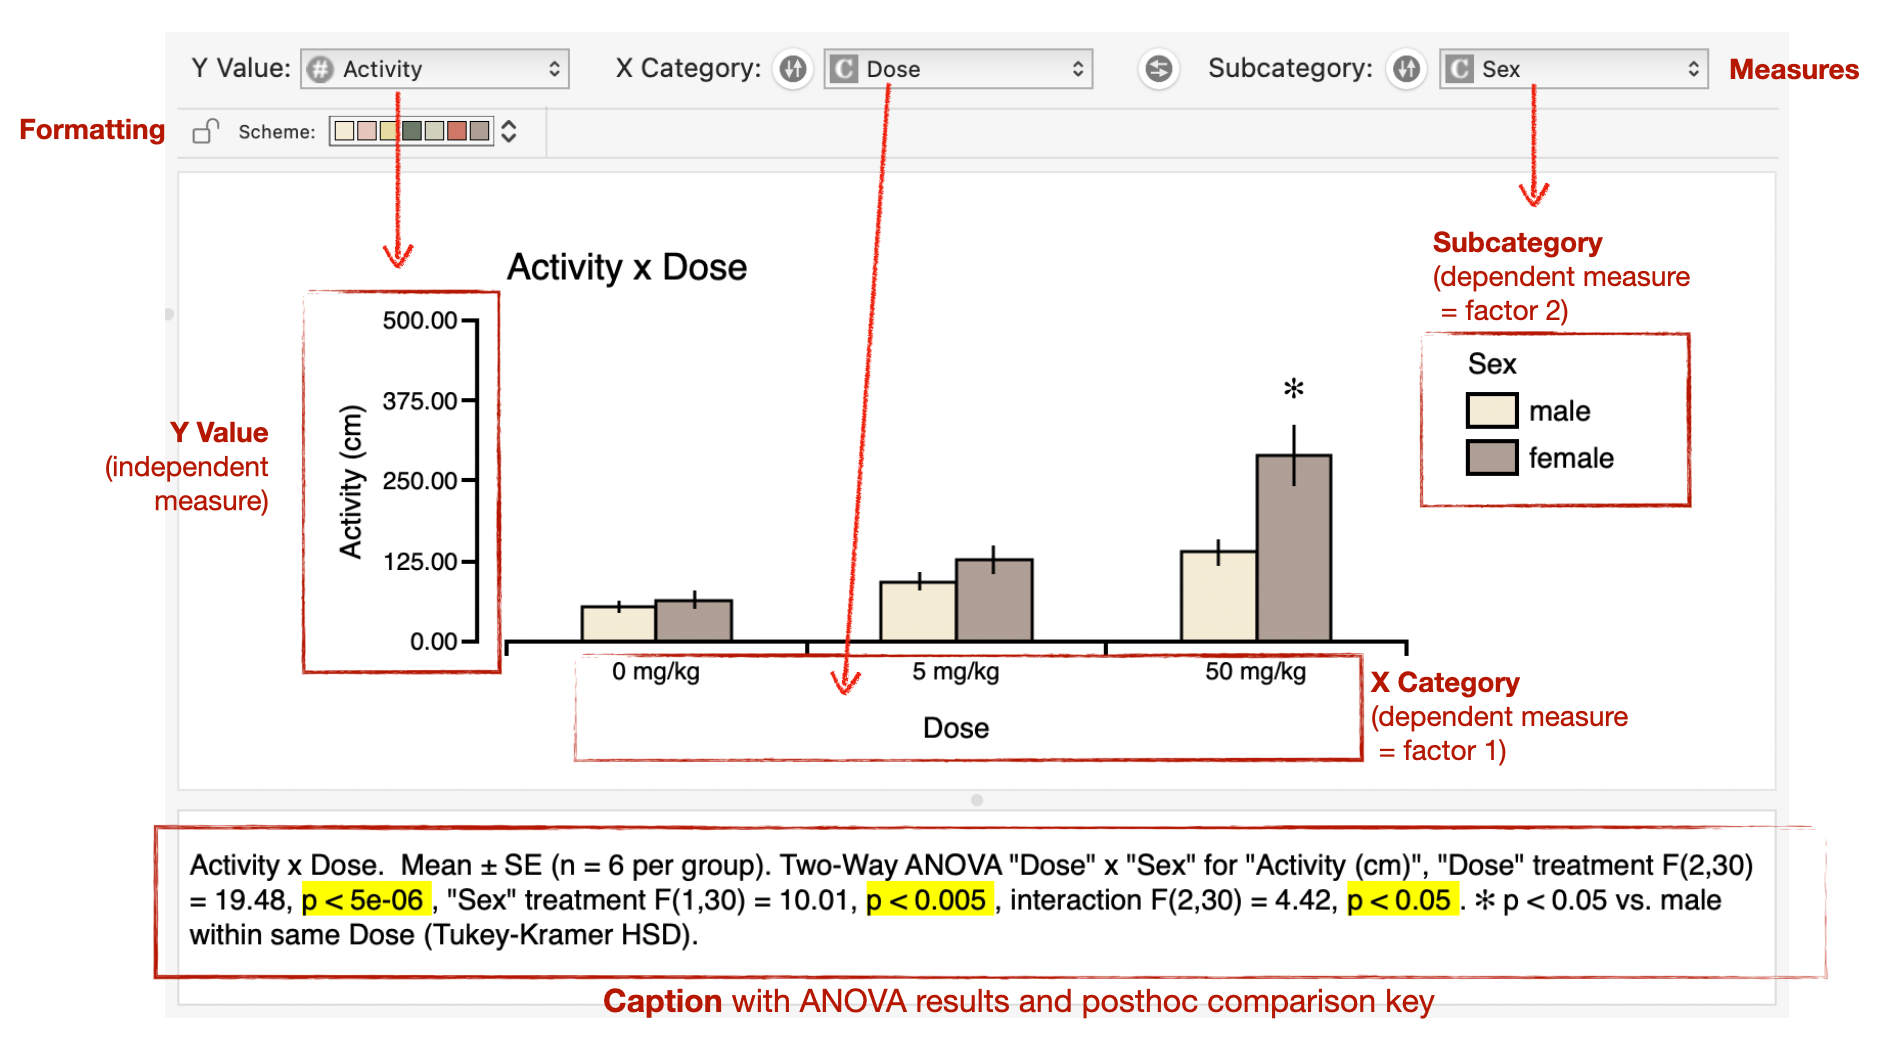
The area of the window for plotting graphs is composed of 3 areas: the graph itself, the measures bar and formatting bar immediately above the graph, and the caption with ANOVA results and post-hoc symbol descriptions immediately below the graph.
The Parts of the Graph
Xynk's graphs are fairly standard, but here we define their constituent parts explicitly, to introduce the mapping of Xynk's controls onto the display and formatting of the graphs.
In general, the parts of the graph can be selected individually, and their appearance (eg font style, line thickness, stroke and fill colors, text of labels) can be set via controls in the formatting bar, via the graph panel of the inspector, or via the main menus -- these are all detailed in later sections.
Xynk graphs come in 2 formats: bar graphs and line graphs. The two types of graphs share most of their parts in common.
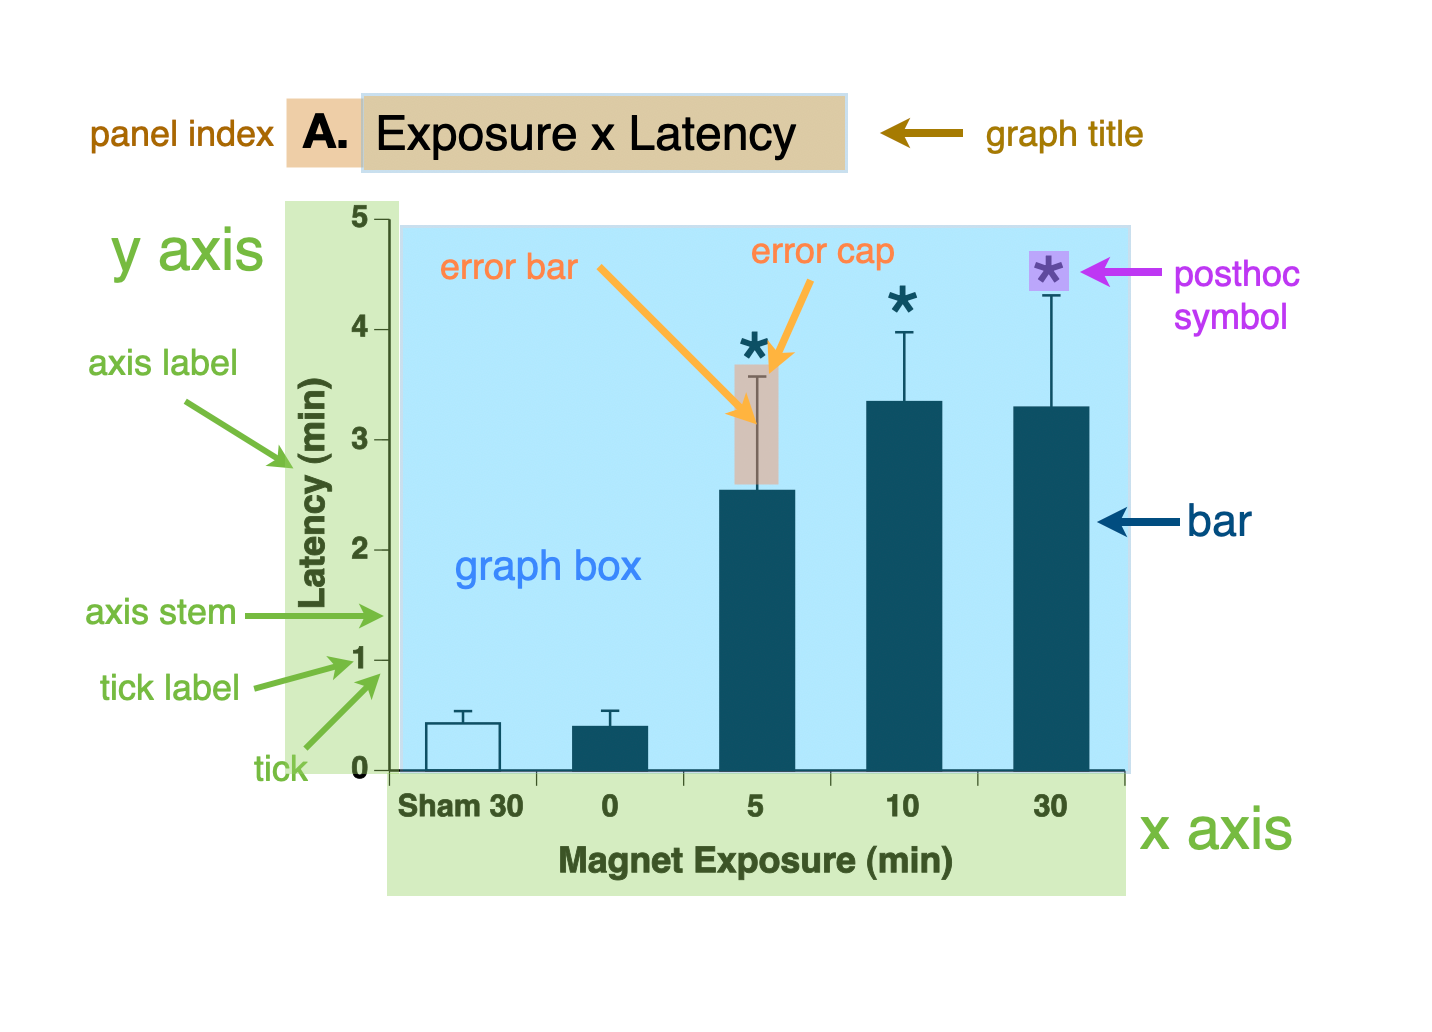
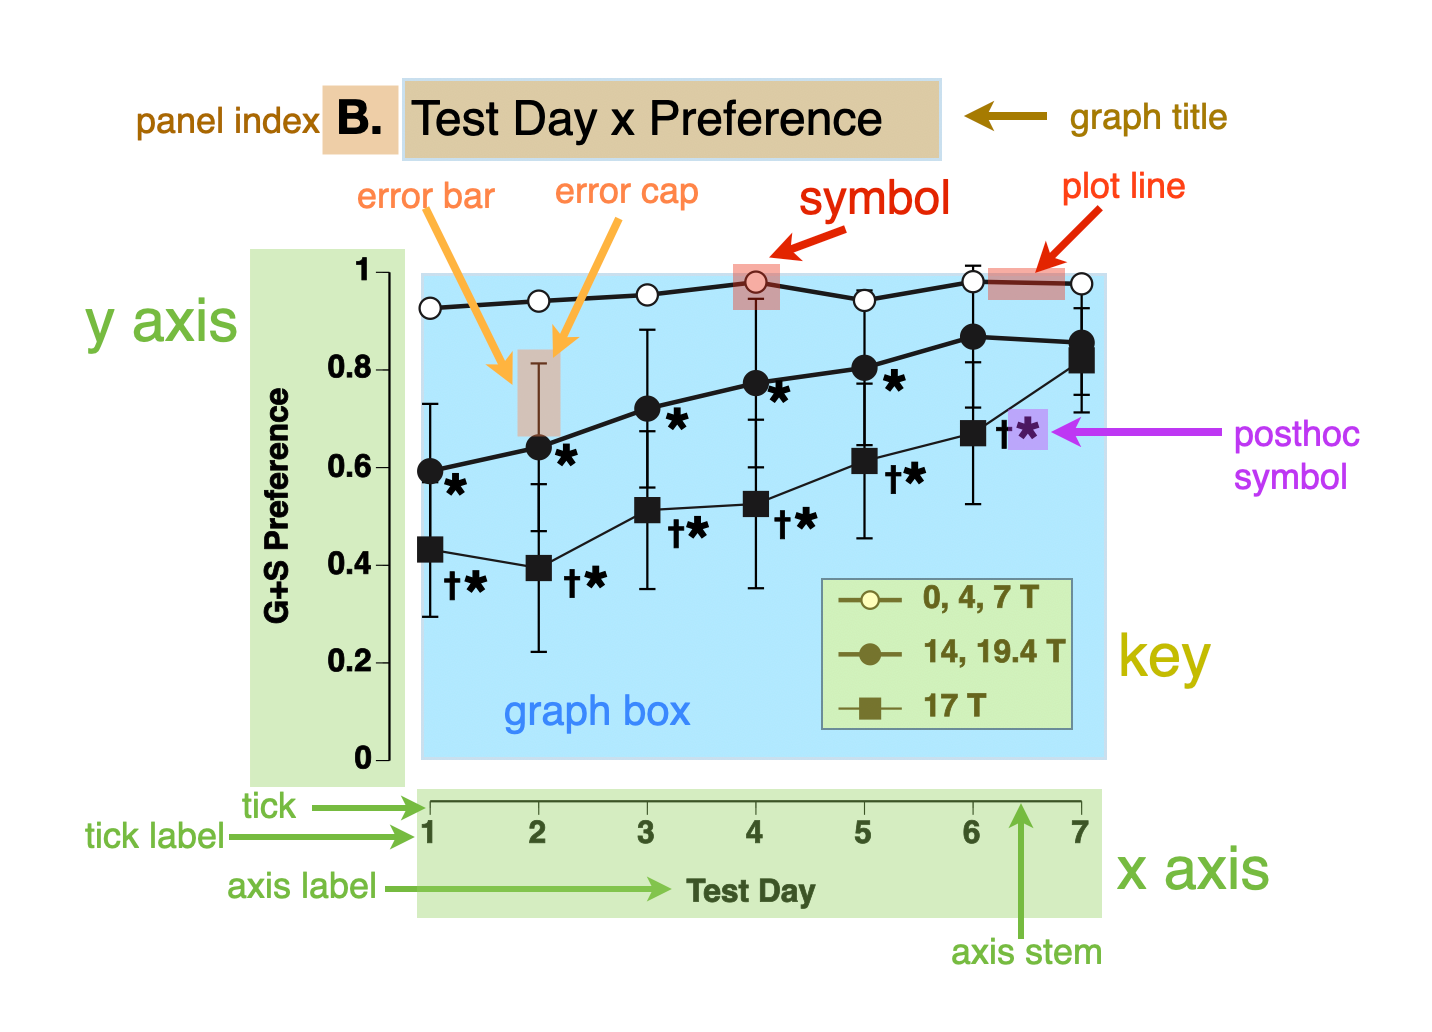
Bar graphs have bars, of course, while line graphs have data point symbols and connecting plot lines. The graph box is the area where the graph's bars or lines are drawn.
X-Axis: set by the graph's current categorical (independent) measure. The X-Axis is composed of the axis stem (the horizontal line itself), vertical ticks, with tick labels beneath them (or under the bars in the case of a bar graph), and the axis label.
Y-Axis: set by the graph's current Y Value, also known as the numeric (dependent) measure of the graph. The Y-axis also has an axis stem, horizontal tick marks, tick labels, and an axis label. Because it labels numeric Y-values, the tick labels of the Y-axis are numbers, and the Y-Axis has a maximum value and minimum value which can be explicitly set, or derived automatically by Xynk.
Error Bars: if the graph is displaying a summary value for a group, such as the mean or median, then error bars can also be displayed to designate standard deviation, standard error, confidence intervals, etc. The ends of the error bars can be decorated with error caps.
Key: If a graph has a subcategory specified (ie bars grouped under each category, or multiple lines in a line graph), then a key box can be displayed to explain which bar color or lines and symbols are mapped to which subcategory group. The key box can be re-position, the order of the key reversed, etc.
Post-hoc Symbols: If the ANOVA finds signigicant effects, then the graph will display the results of post-hoc comparisons among the groups. Post-hoc results can be displayed in one of 2 ways:
a post-hoc symbol (eg * or †) to indicate a significant difference between selected groups. For example, every group might be compared to a single specific control group, and if a group's average is significantly different from the control, an asterix would be drawn above the group's bar or line symbol. Setting up the predicates for specific post-hoc comparisons is explained in the Post-hoc Comparisons section
letters (eg a,b,c...) to indicate which groups are not significantly different from each other. Groups with the same letter above their bars or line symbols are not different from each other, according the selected post-hoc test, while groups which do not share letters are significantly different. Xynk can automatically assign the appropriate letters to the groups, which makes it very fast and east to see any and all differences among the groups.
Graph Title and Panel Index: A title is displayed at the top of the graph. By default, the title is set to a combination of the names of the numeric measure (Y-Axis) and categorical measure (X-Axis) and , e.g. "Body Weight (g) x Drug Dose". The title can be edited by directly clicking on the title in the graph window, or via the Inspector's graph panel. You can also set a panel index, such as "A.", "B.", etc., for individual graphs in the graph Inspector.