1.9 The Statistical Results Table
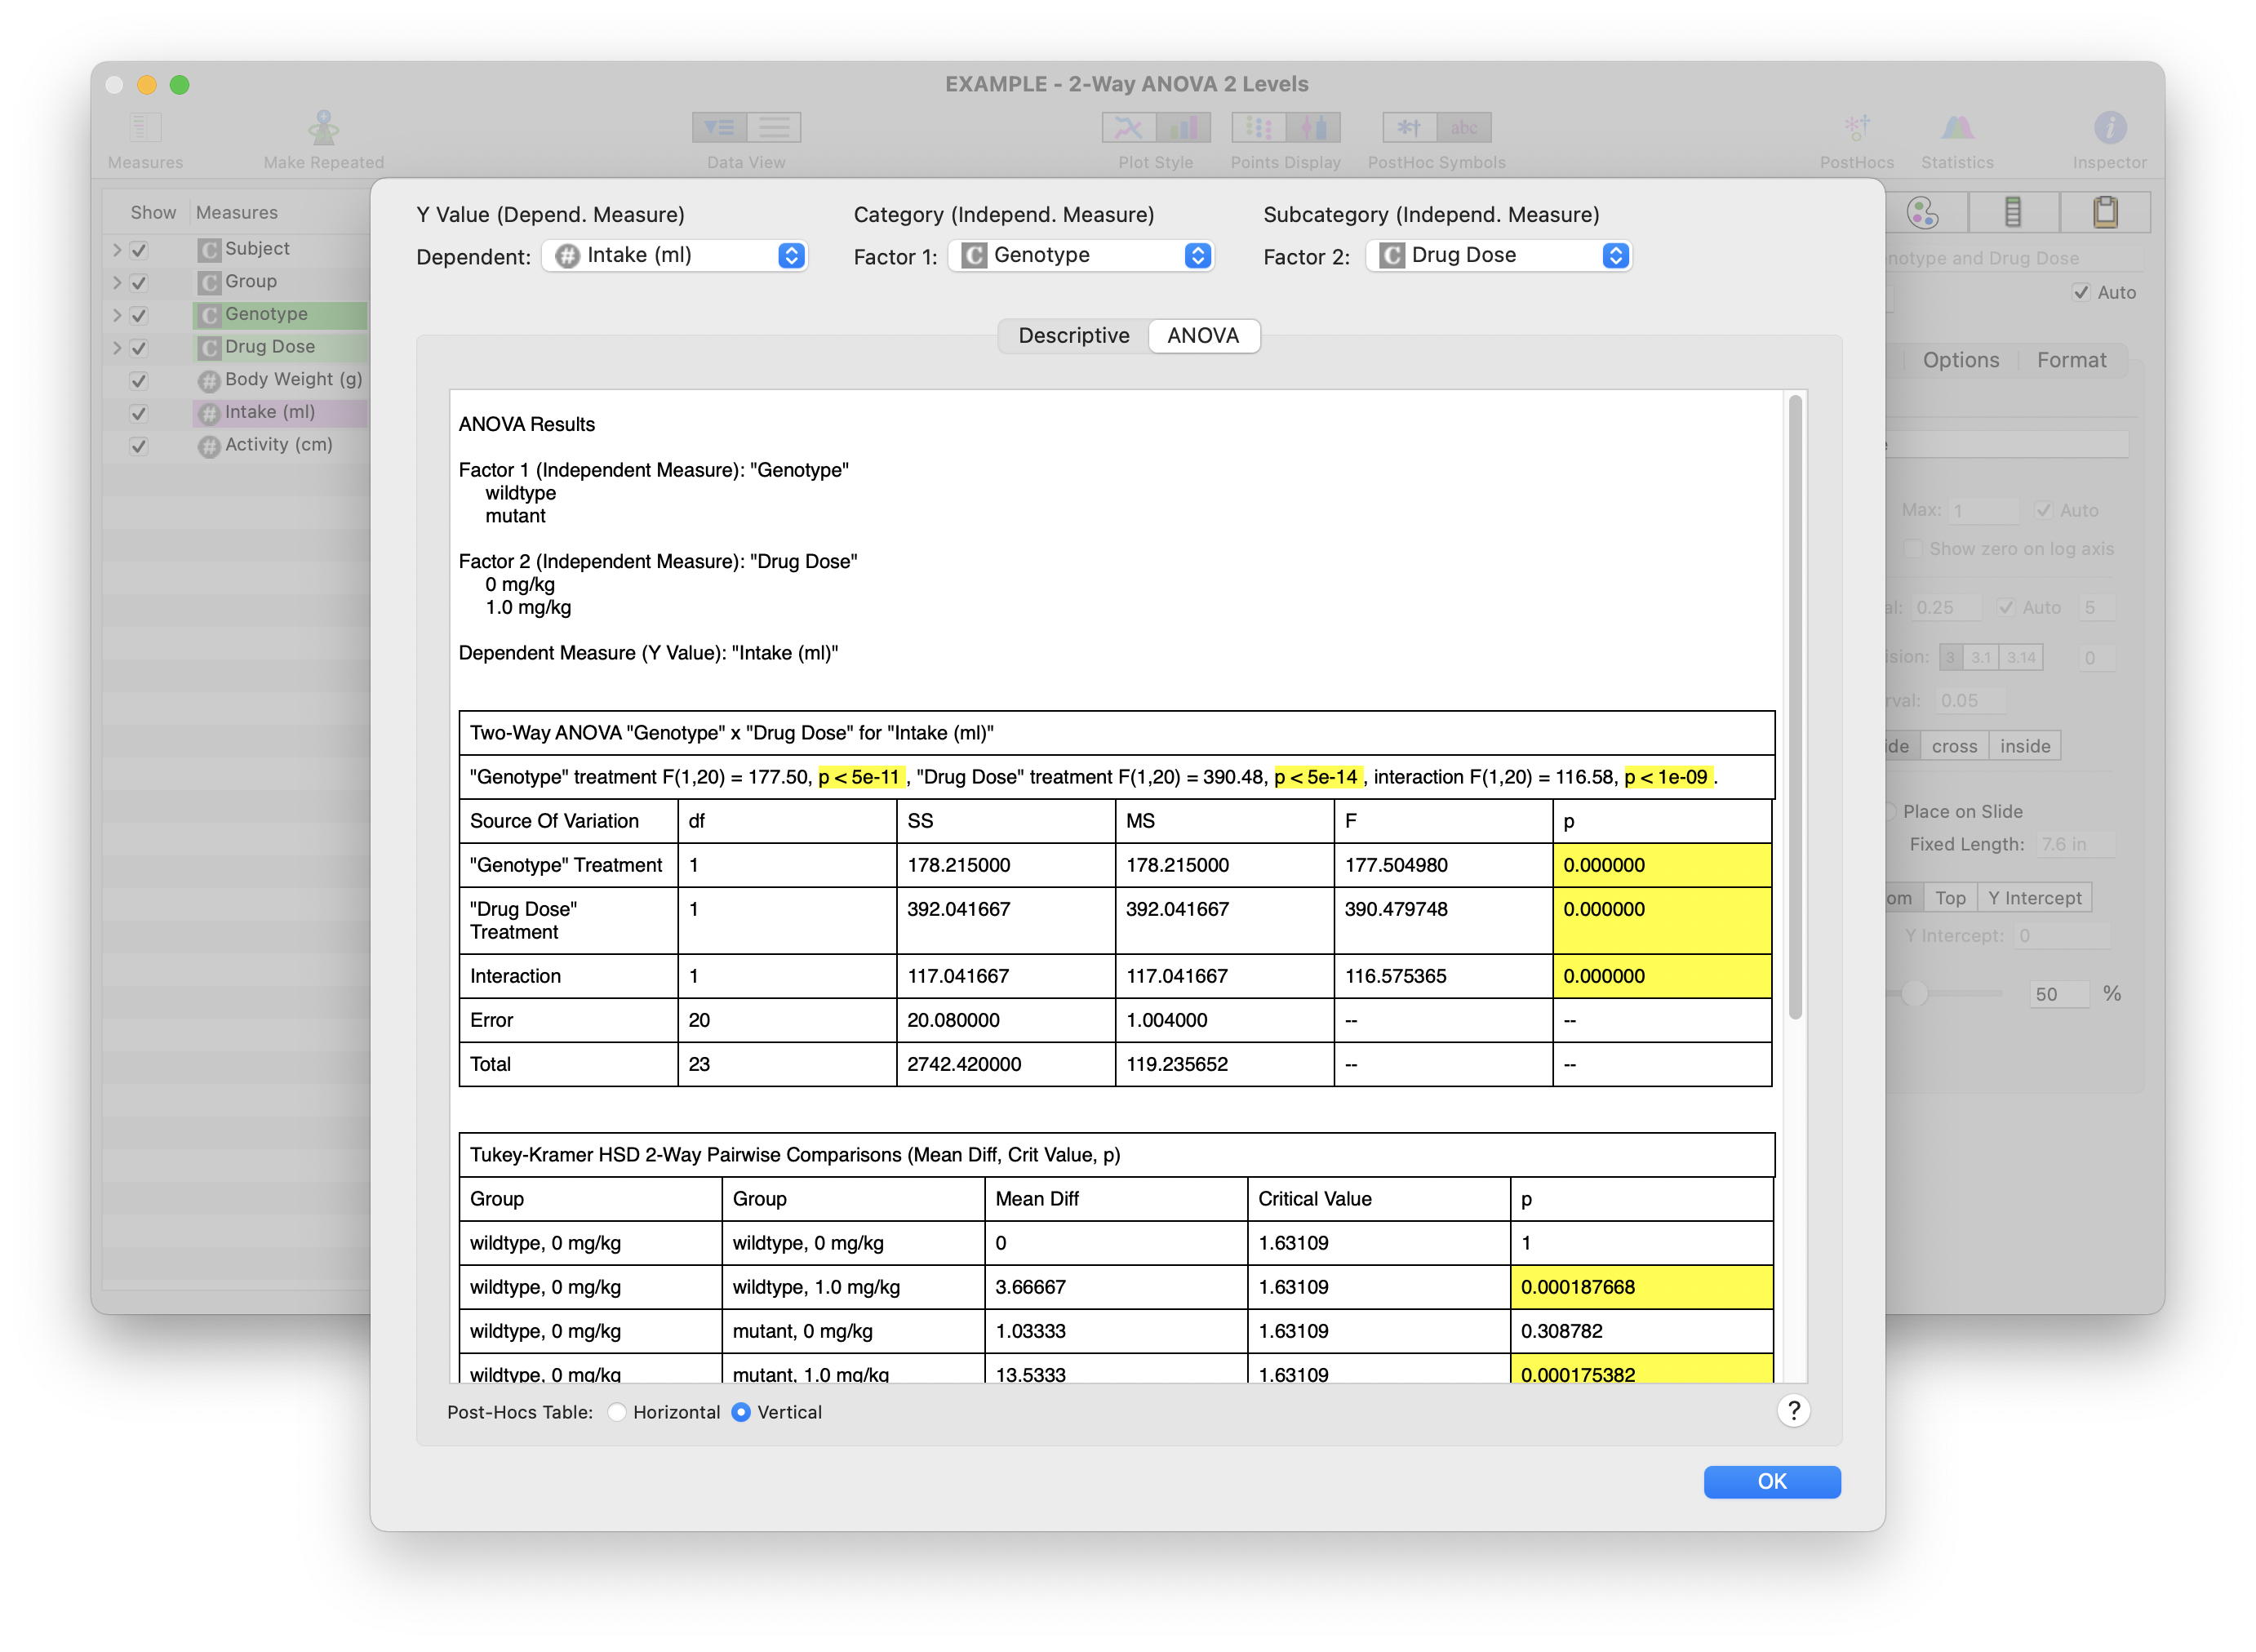
Xynk automatically calculates one- or two-way ANOVAs, along with post-hoc comparisons if the ANOVA is significant. To get a detailed table of the ANOVA results and comparisons, click on the "Statistics" button in the tool bar.

This will open the Statistical results window. The ANOVA table is present, and post-hoc test results are tabulated for every possible pairwise group comparison.

You can look at the table of post-hoc comparisons either vertically (with each pariwise comparison on a single row) or horizontally (with the comparisons presented in a matrix). You can also copy or save the results in a CSV file. See the Table of Results section for more details Note that you can change the dependent and independent measures right in the Statistical Results Window to investigate other variables, without having to go back to the graphing window.
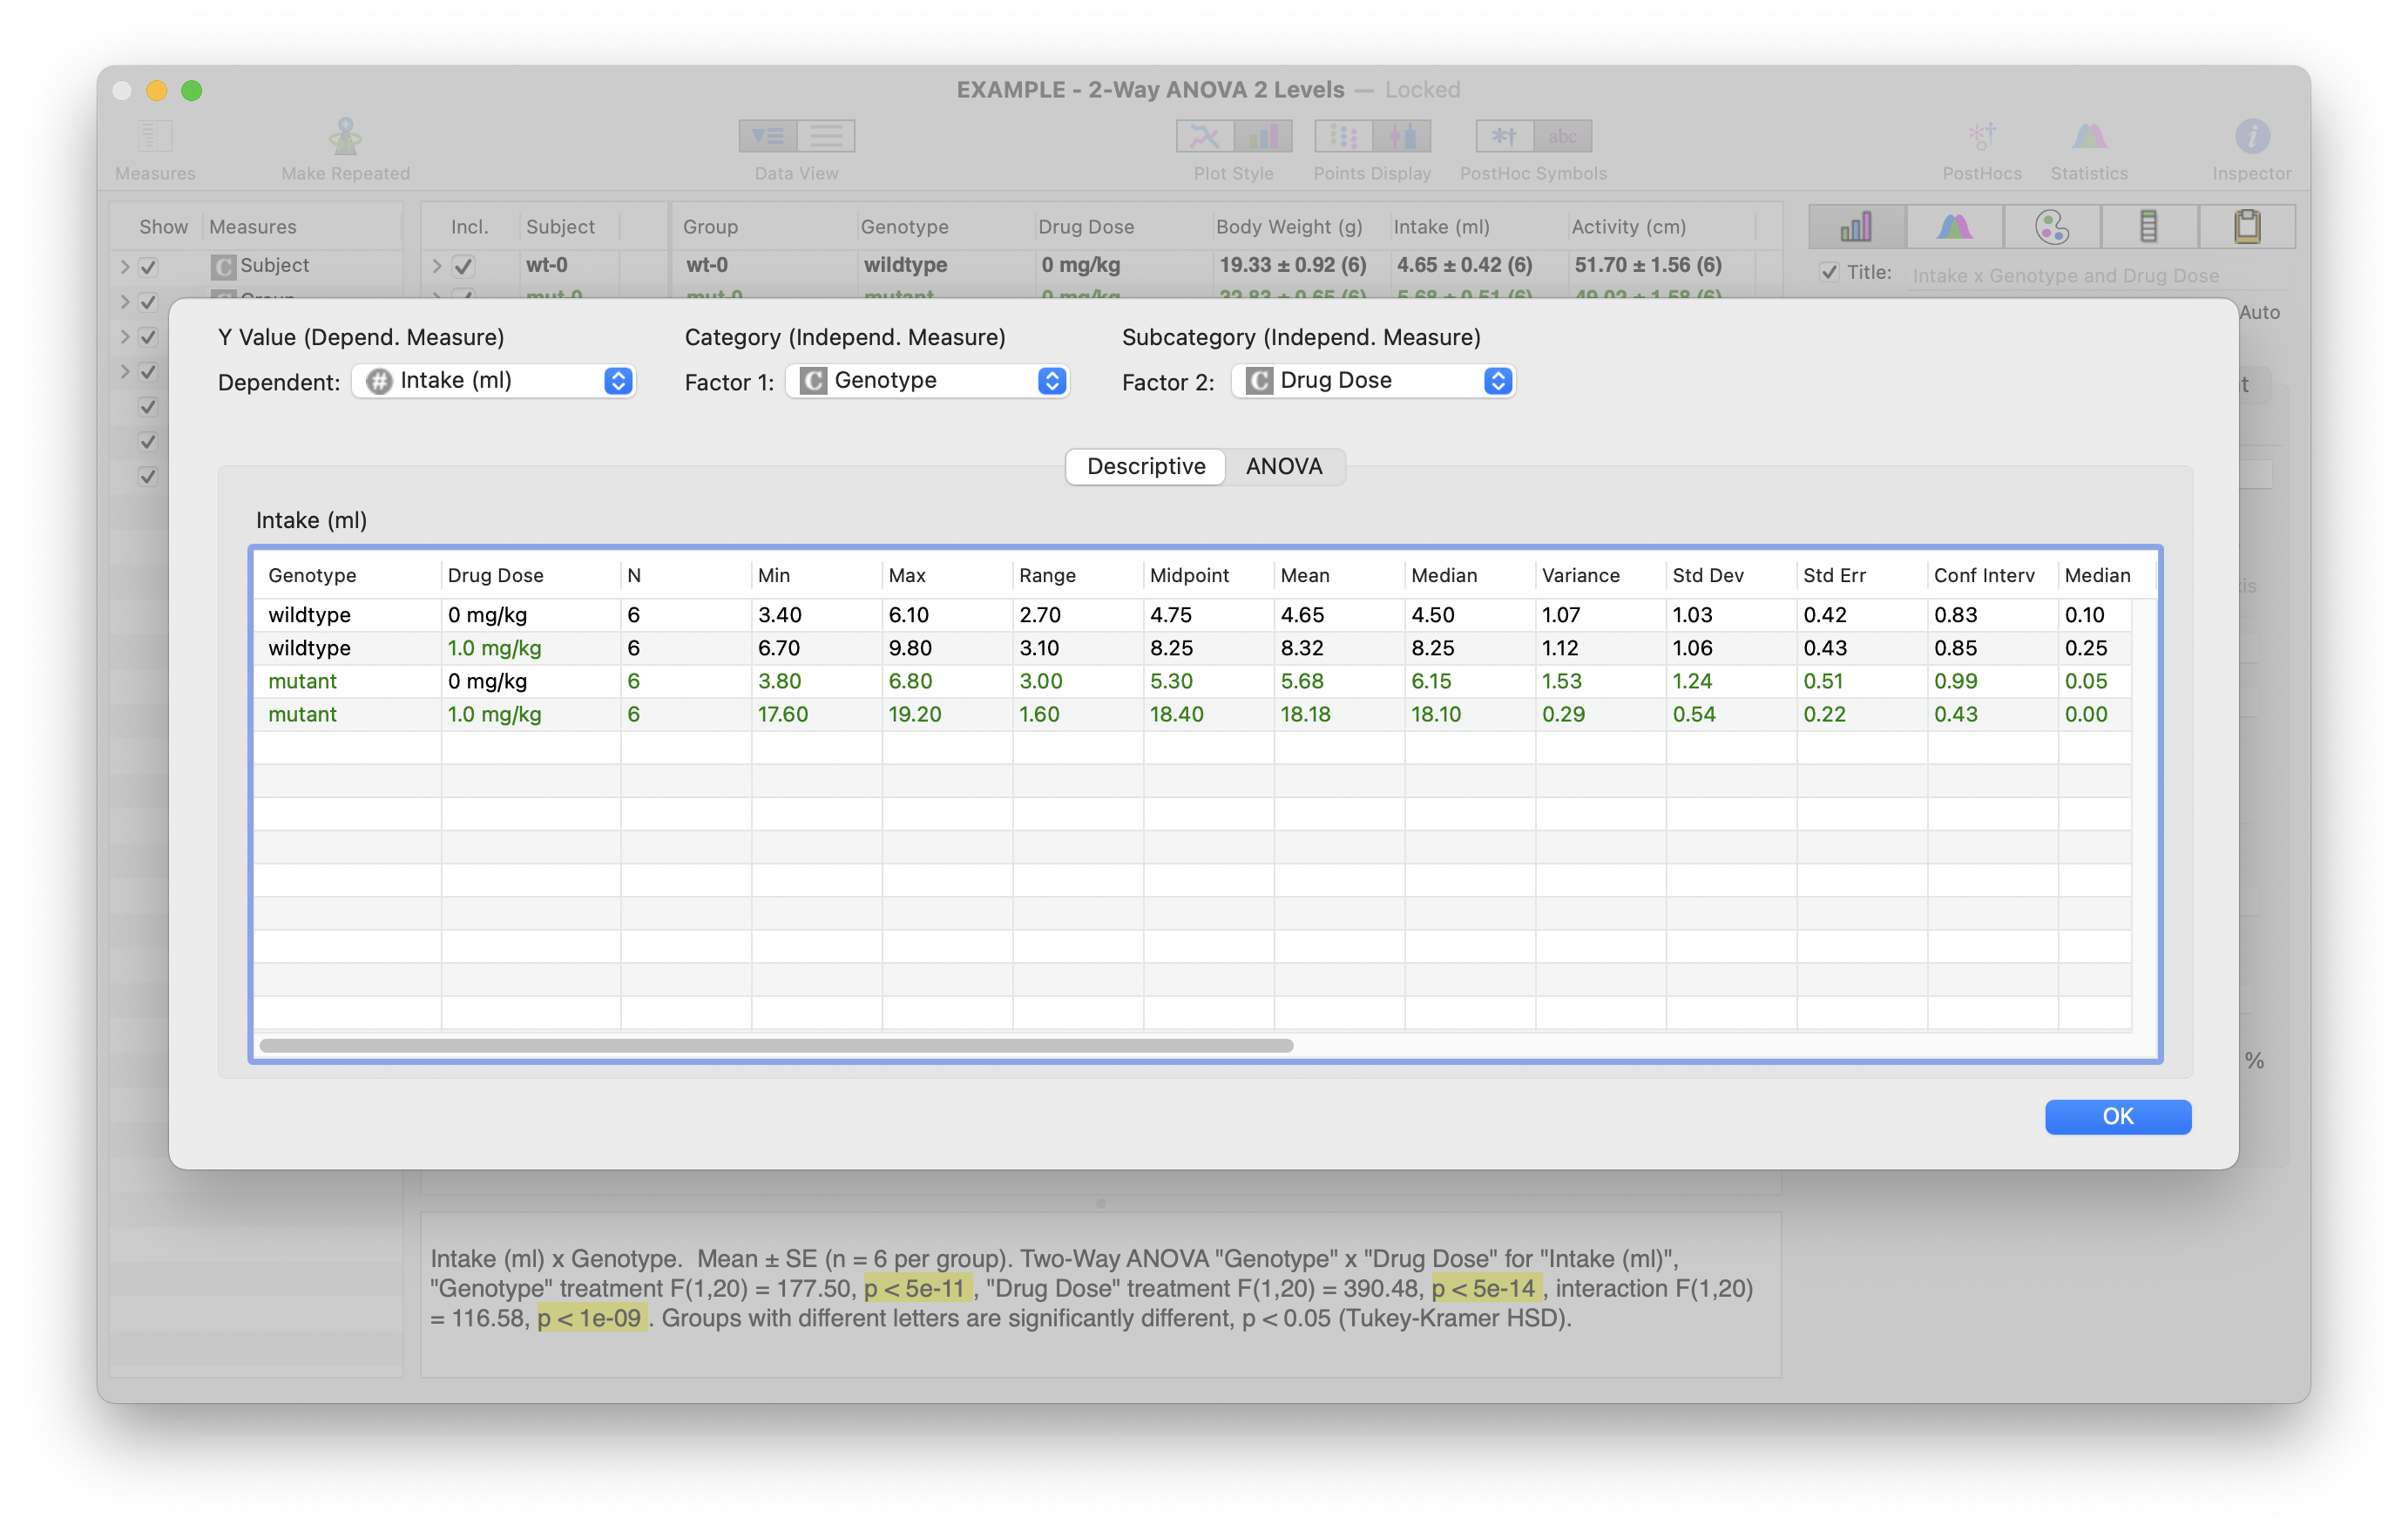
You can also switch to viewing descriptive statistics for the selected numeric measure by clicking on the "Descriptive" tab. When you're done viewing results, click on "OK" to return to the main graphing window.
