1.4 Subcategories
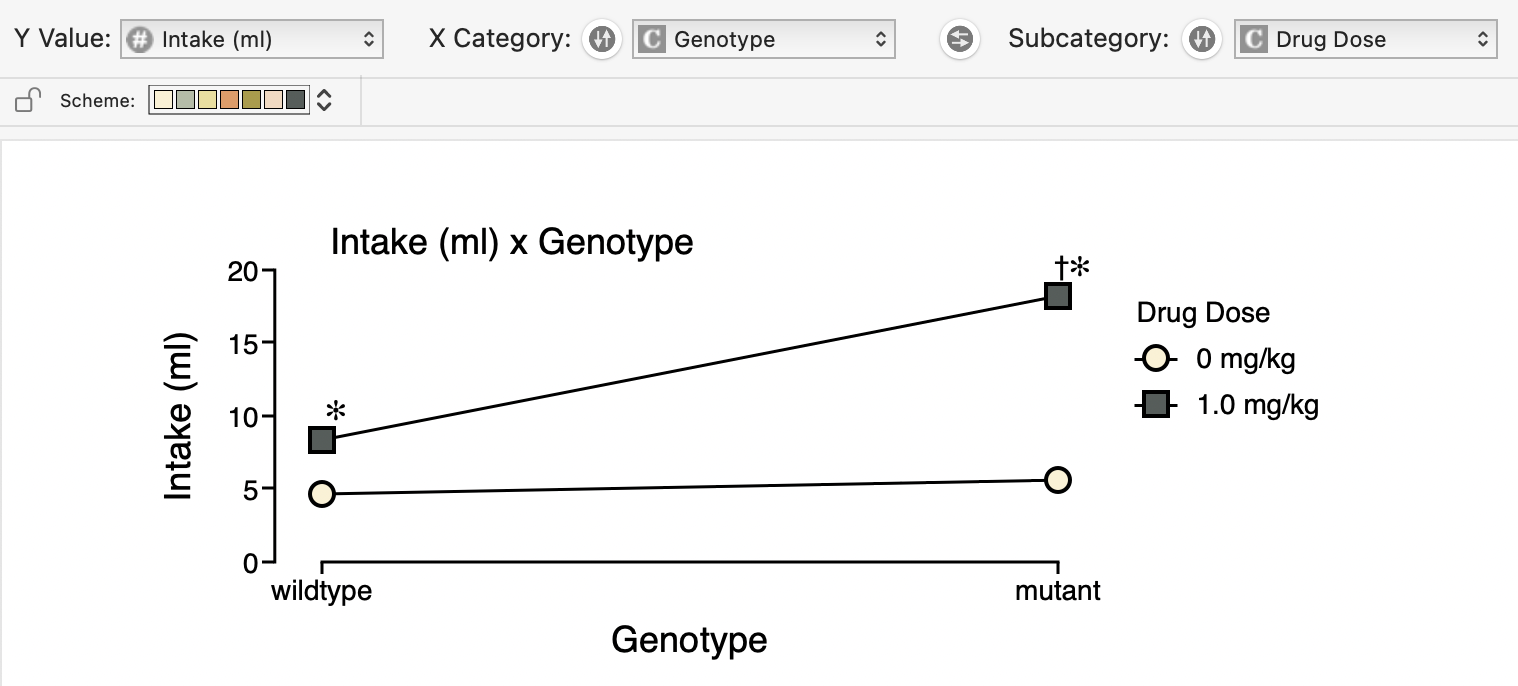
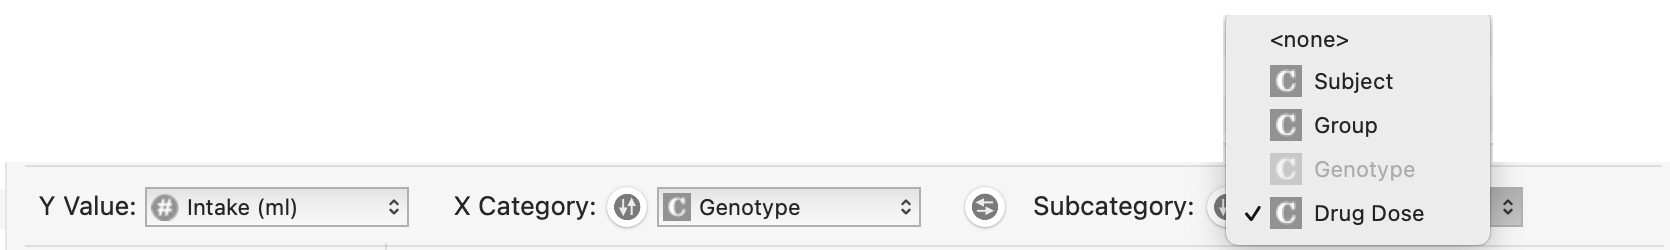
If a dataset contains more than one Categorical Measure, then one of the Categorical Measures can be plotted on the graph as a Subcategory. In our example experiment, there were 2 levels of independent categorical measures: "Drug Dose" and "genotype". So, we graph "Food Intake" as the Y-axis numeric measure, against "Drug Dose" as the X-Axis category, and also select "genotype" as the subcategory. You can select a subcategory by option-clicking on a categorical measure in the Measures source list, or by using the Subcategory popup in the Measures Bar above the graph. You can also swap the category and subcategory measures using the ⇄ button in the Measures Bar.

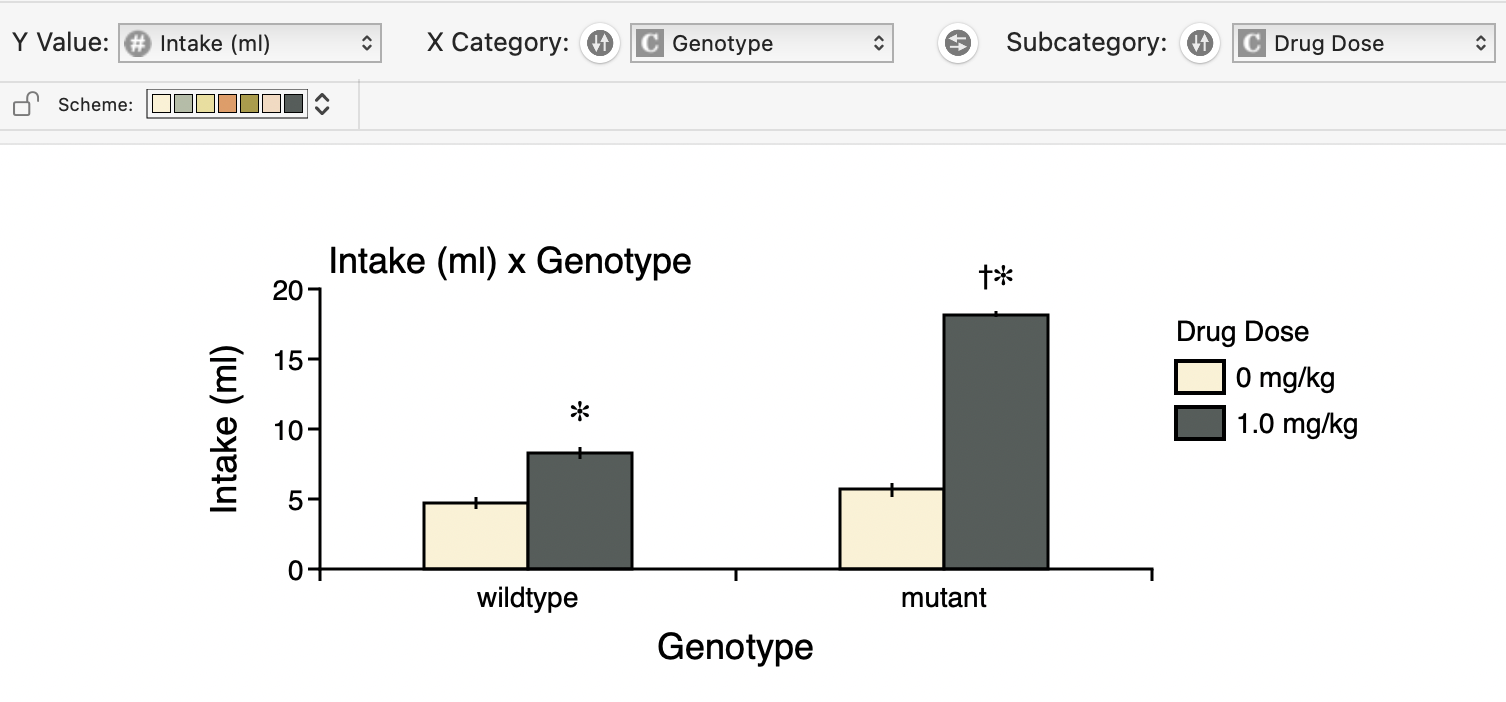
In a bar graph, the subcategory is plotted as adjacent bars within a category. In a line graph, the subcategory groups are plotted as separate lines and symbols, with the symbols above the main categories.