1.5 Repeated Measures
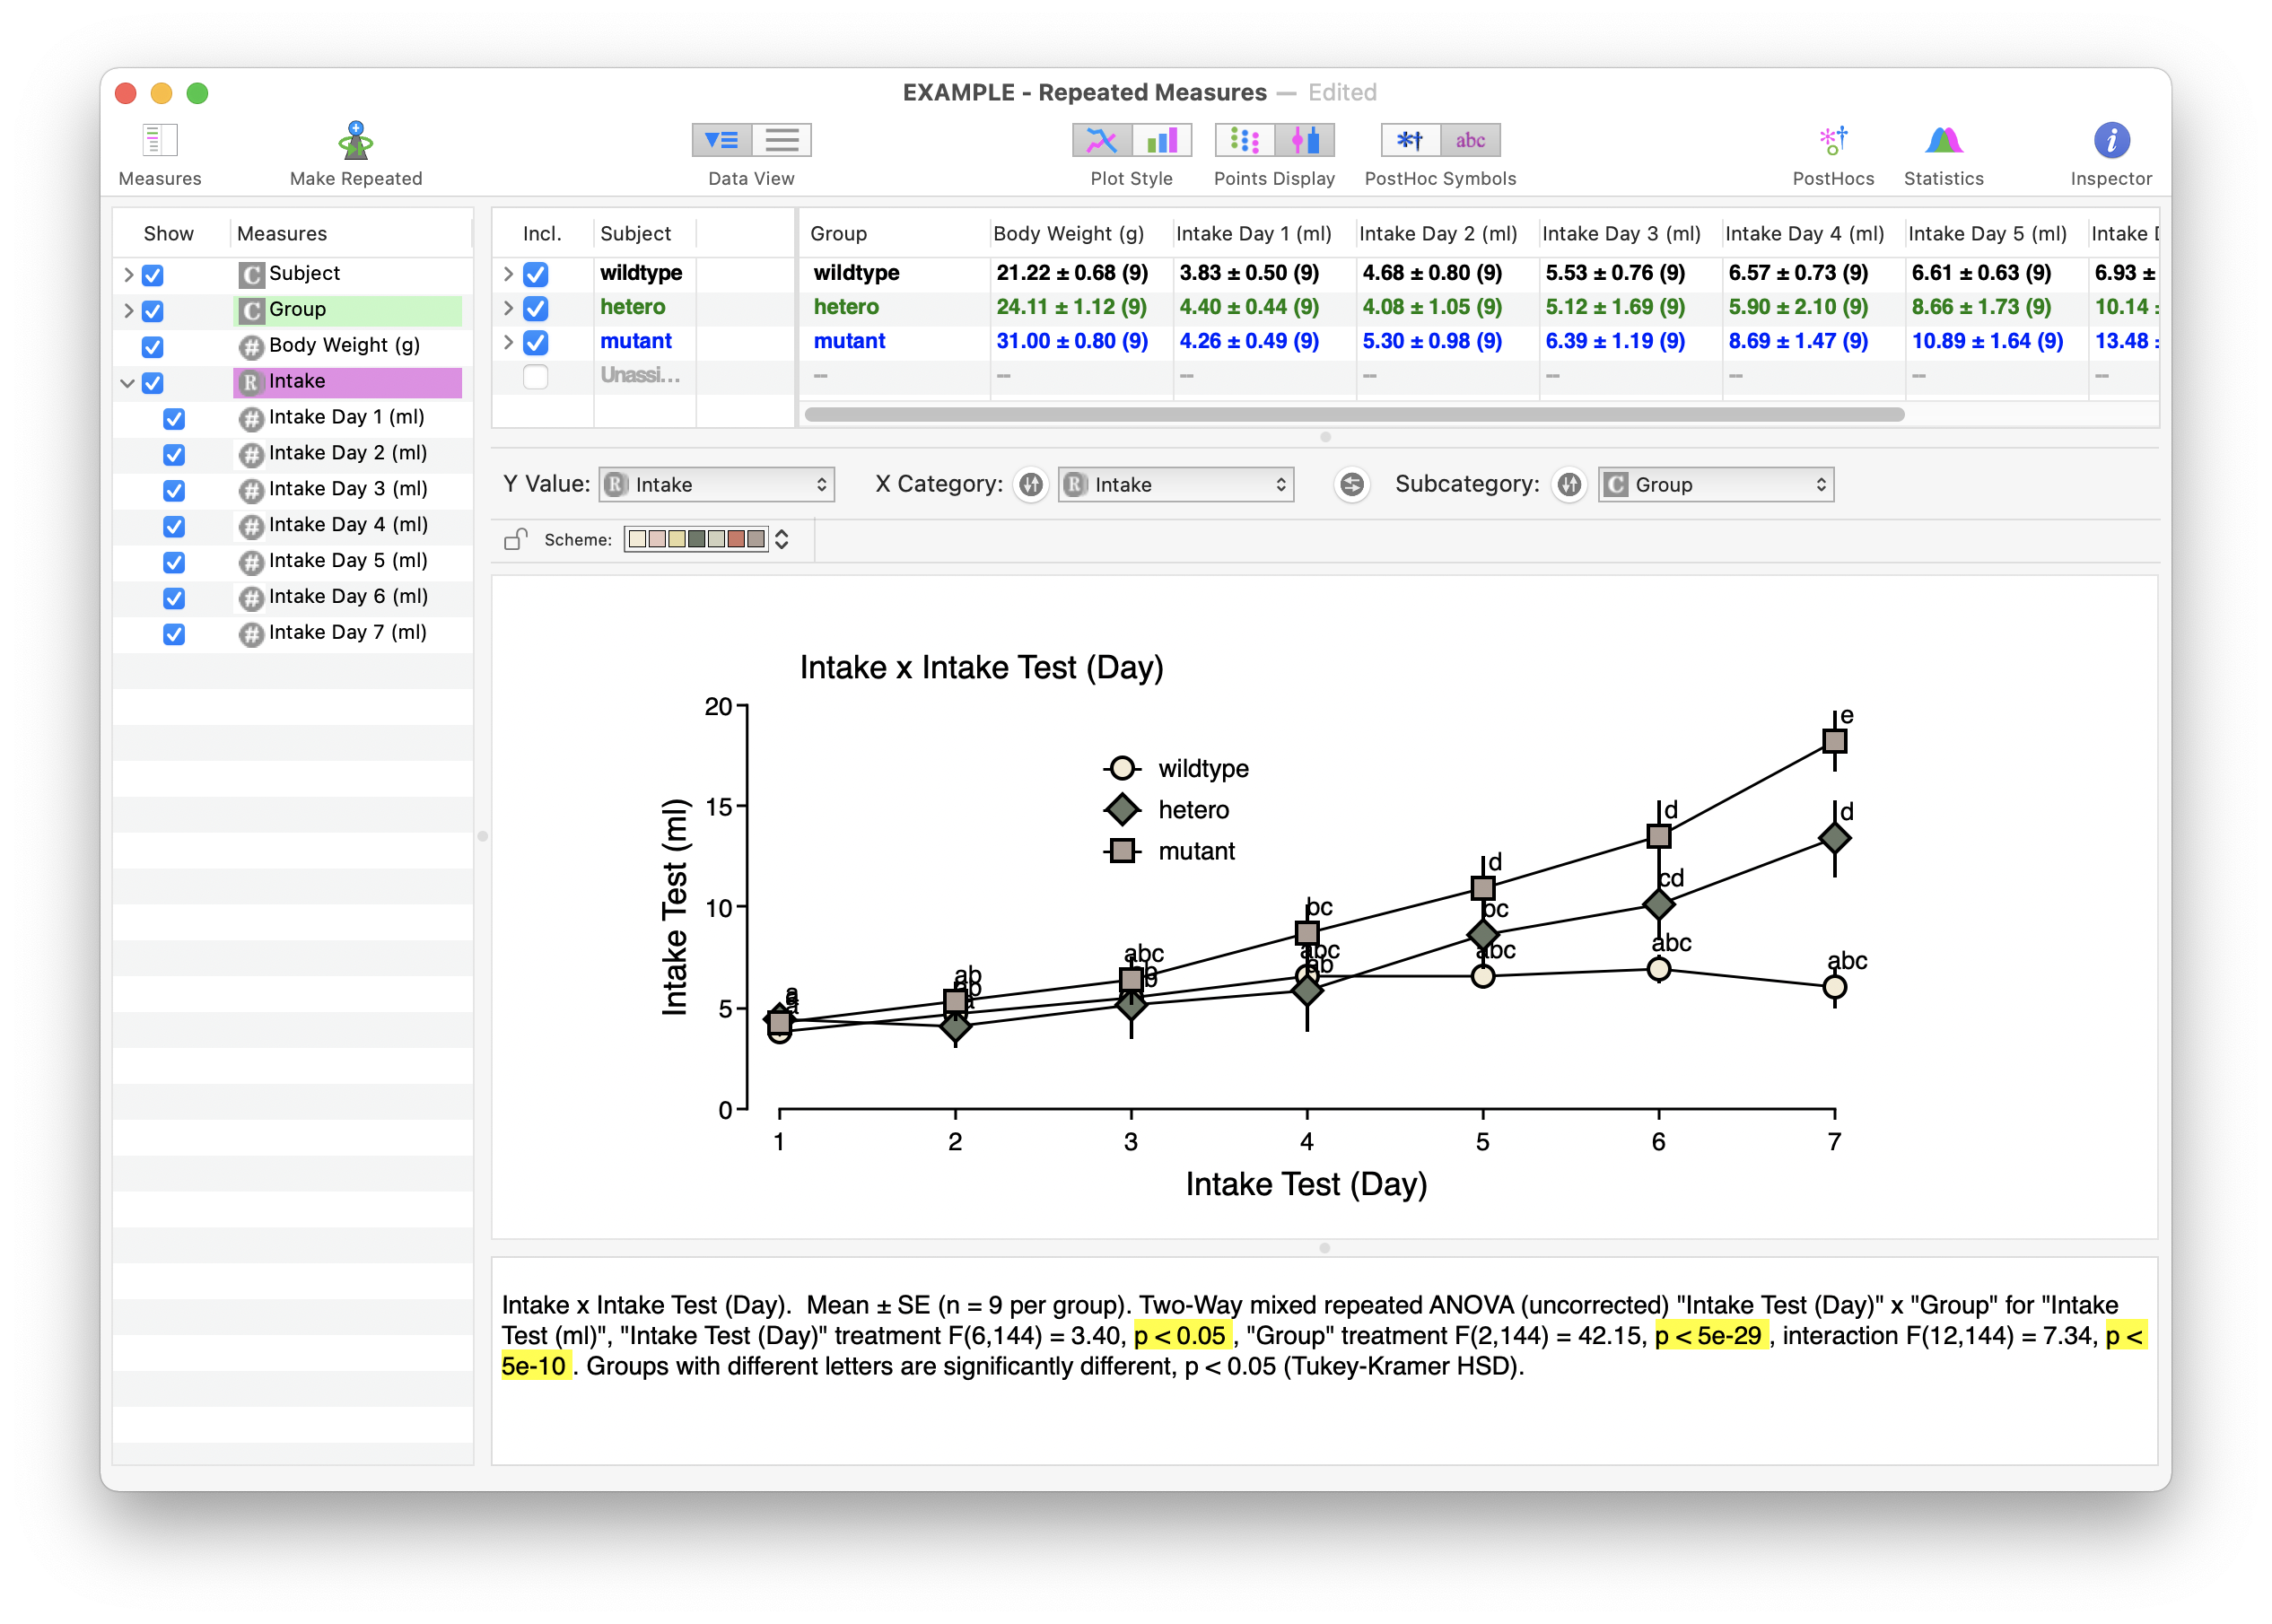
You can also plot and analyze data in repeated measures format. An example can be seen in the "Repeated Measures" example file. If your data file contains consecutive columns with numeric measures representing the same type of data collected repeatedly on each subject, then the individual measures can be grouped into a single repeated measure. The repeated measure serves to specify both the y-value for a graph, and the x-axis values: the x-axis will have a category tick for every submeasure in the repeated measure ("Intake Test Day") in this example, and the summary data (eg the mean and SEM) for each day will be plotted against the common y-axis.
See the Repeated Measures in Data Files and Repeated Measures ANOVA sections of this guide for how to set up repeated measures in a data file.
Running a 2-way ANOVA with 1 repeated measure requires an in-app purchase, although you can see the results of such an analysis in some of the unlocked example files.