6.2 Graph Inspector
Title and Panel Index

Has 4 subpanels for configuring the x-axis, y-axis, other options, and formatting of graph elements.
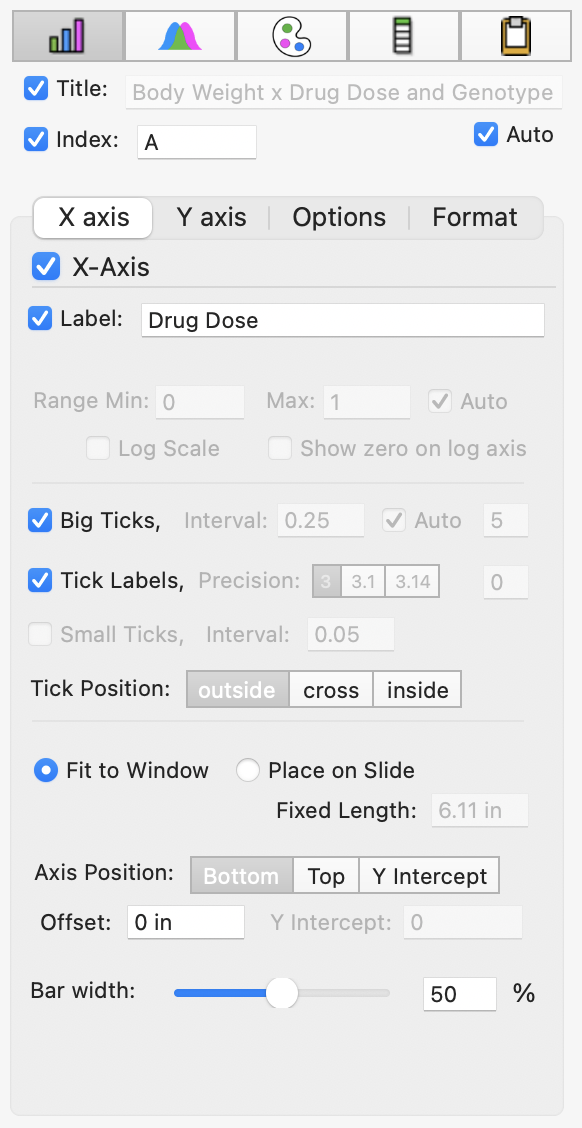
X-Axis

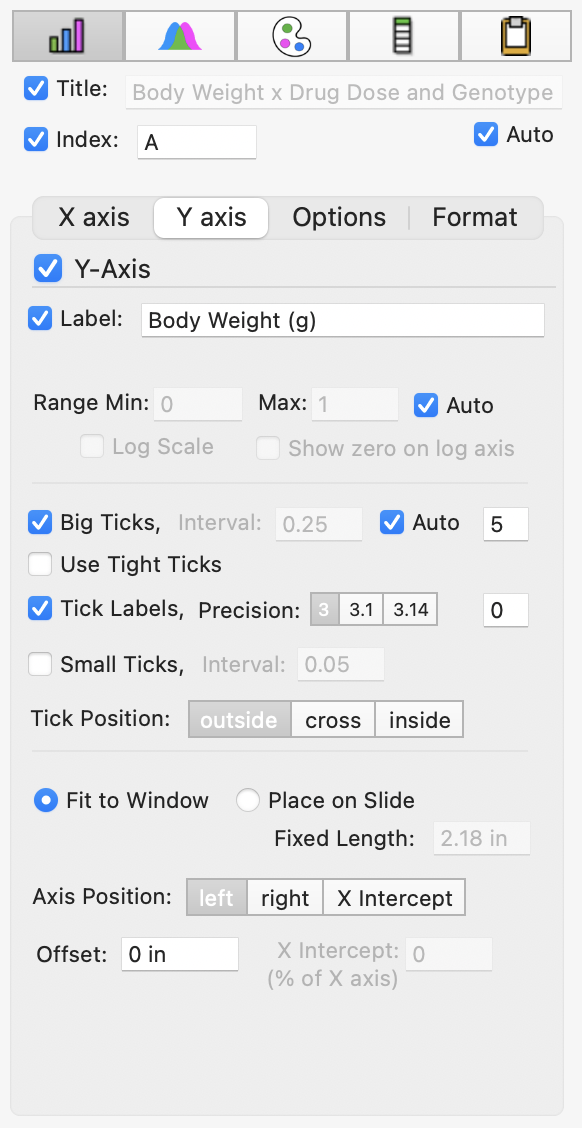
Y-Axis

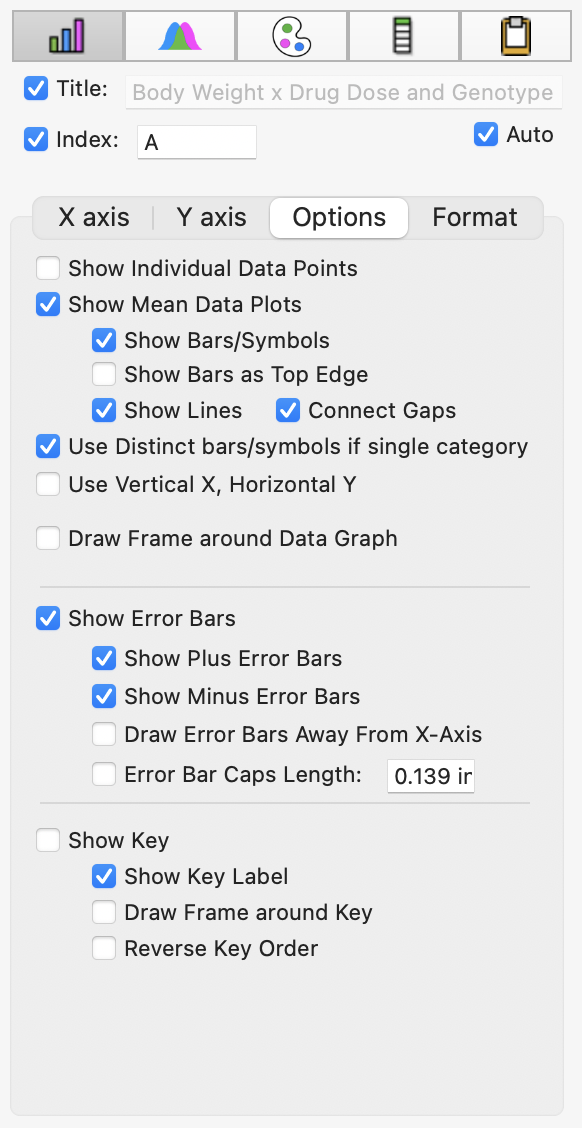
Options

Individual Points vs. Mean Values
Individual Points or a summary value (eg mean or median) can be displaced (or both can be displayed at the same time).
Summary values can be plotted as full bars, or full lines-and-symbols, in bar graphs and line graphs respectively.
In a bar graph, the full bar can be hidden and only the top line of the bar can be shown: for example the mean could be shown as a horizontal line amongst the individual points.
For line graphs, the connecting plot lines can be shown or hidden, and likewi se the symbols can be shown or hidden.
Error Bars
Key Display
Format

Text Formatting
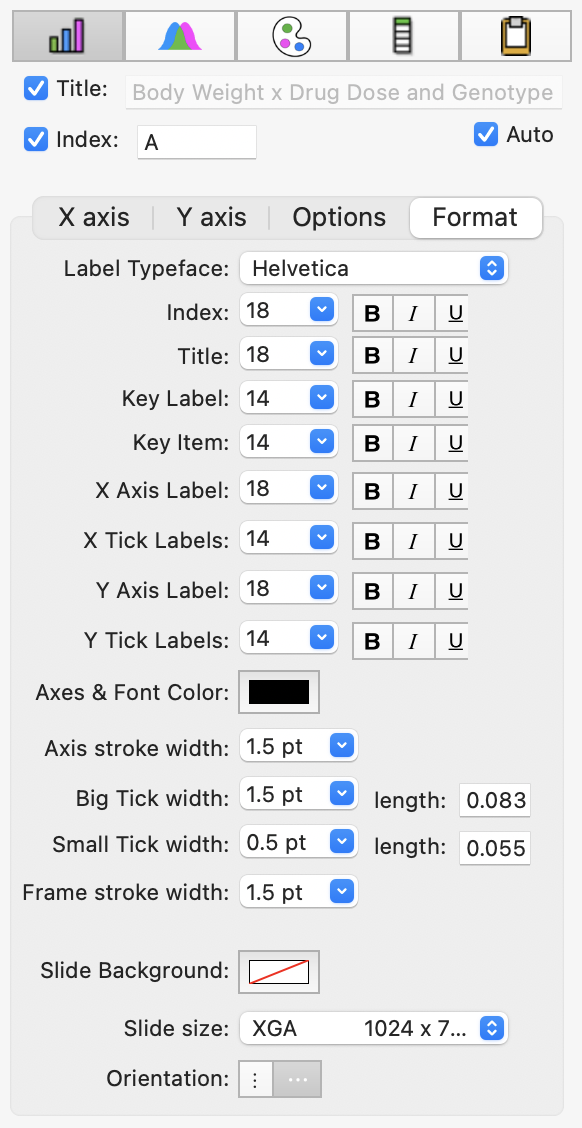
The typeface, fontstyle, size, and color of the text elements in a graph can be set by directly selecting the element and using the formatting bar pop-up menus. You can explicitly set the appearance of text elements all in one place within the Graph -> Format inspector panel. Note that a single typeface is used for all text elements of the graph. The formatting of text elements applies to all graphs in the file. (You can set the default font style in Xynk Preferences -> Fonts & Colors).Slide Background
You can change the background of the graph here. The background is applied to all graphs in the file. You can also edit the background of the current color scheme in the Color Scheme inspector panel.Slide Size and Orientation
Graphs are drawn and sized in the graph window in one of two modes: "Fit to Window" or "Fixed Size". The current mode can be set either via the Graph -> Resizing menu item, or via the X-Axis or Y-Axis panels of the Graph Inspector.
If the Graph is in "Fixed Size" mode, you can specify here (or via the Graph menu) the size of the graph's "Slide" (ie to match different screen sizes or paper sizes), and specify the orientation of the slide as portrait ( ⋮ ) or landscape ( ⋯ ).