3.6 Formatting Fonts, Lines, And Bars
Depending on their type, the appearance of the graph elements can be specified in various ways (e.g. stroke color and style, fill color and pattern, or font size and typeface). To change the appearance of an element, select it by clicking on the element (or its symbol in the graph key). The element will be outlined in light blue, and then you use the formatting bar directly above the graph to apply new attributes.
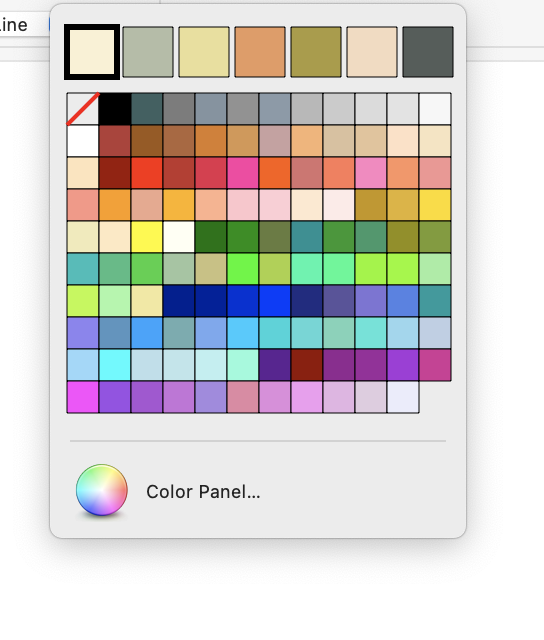
(You can also set a graph to a complete pre-existing color scheme.)
Bars and Graph Box
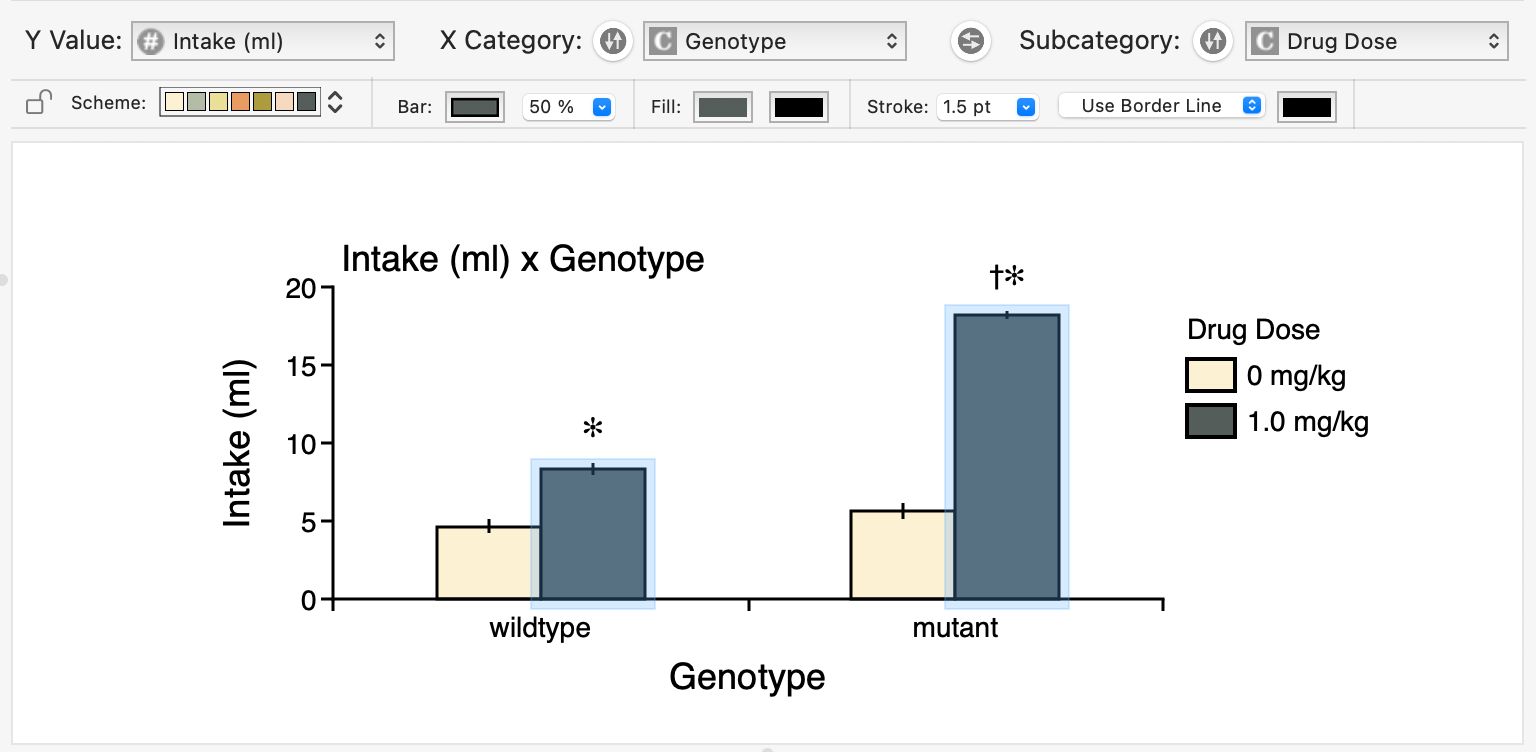
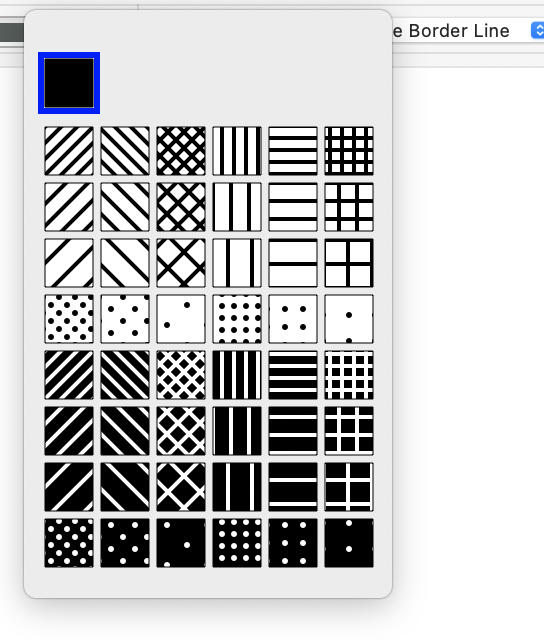
If a bar is selected by clicking within the bar, or in the graph key, you can set the bar colors either using the current bar palette (labelled "Bar:"), or set to an arbitary style with "Fill:" and "Stroke:" menus. You can also set the bar width with a pop-up menu. For the color of the bar's outline or border, you can choose either an arbitrary border color (applied to all the bars for a consistent outline, for example black ), or use the same color as the bar interior.
You can also set the fill and outline of the entire graph box (where the graph is displayed) by clicking anywhere within the graph's background (ie between the x and y axes).
Axes and Plot Lines and Symbols
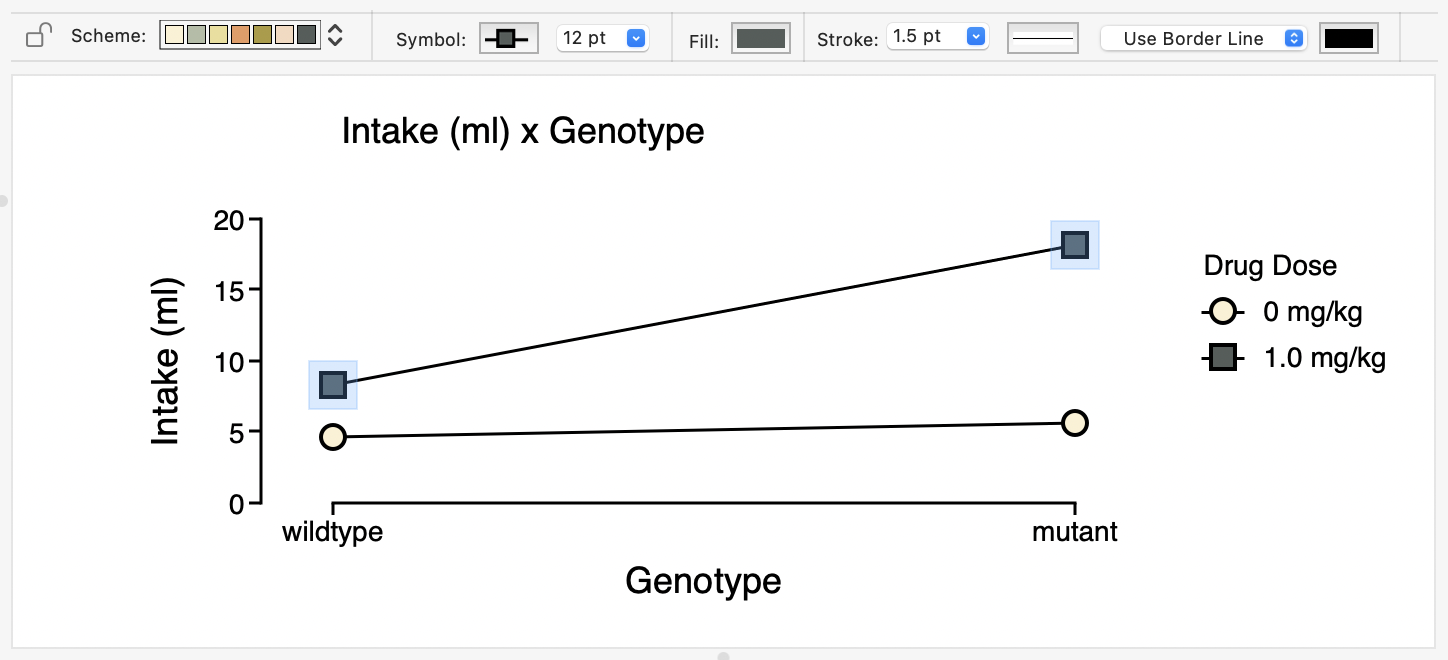
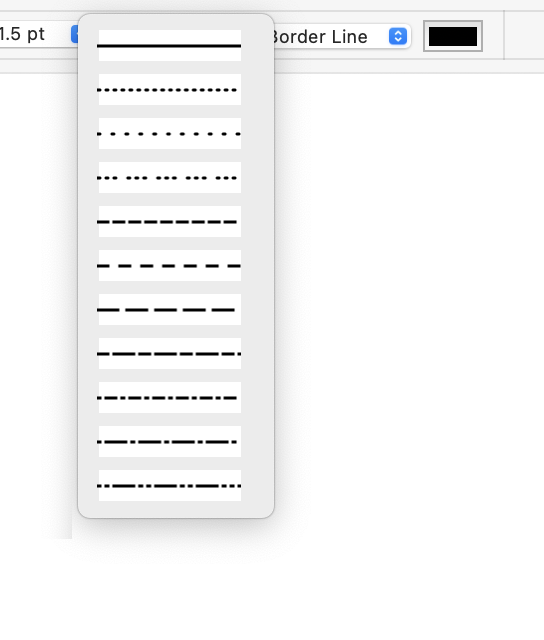
Linear elements in the graph, in particular the axes but also the connecting plot lines of line graph, can be selected and the stroke color, stroke width, and the stroke pattern (solid dotted, dashed, etc.) can be set from the formatting bar. Select an axis by clicking on the axis stem; select a plot line in a line graph by clicking on one of the symbols (or the symbol in the graph key.)
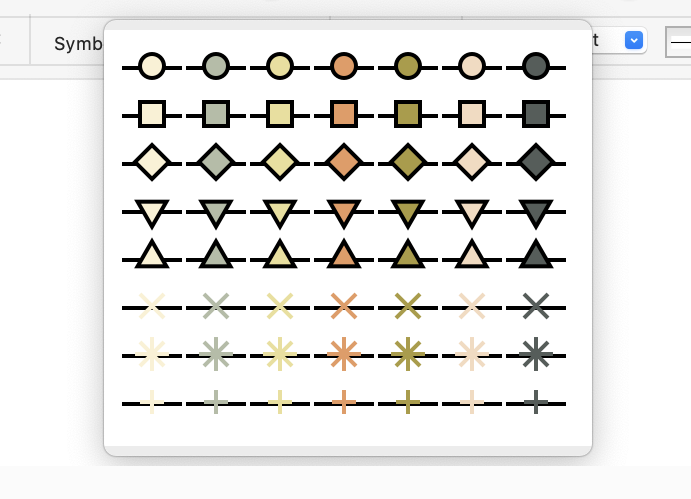
Different symbols for the line graph plots can be selected from a symbol palette popup. The symbols also have a fill color. You can set the color of all the connect plotlines (and the stroke of the symbol outlines) to the same color via "Use Border Line", so that the lines are all consistent (e.g black); or you can set the plotlines to use the same color as their symbols ("Use Symbol Color").
Text
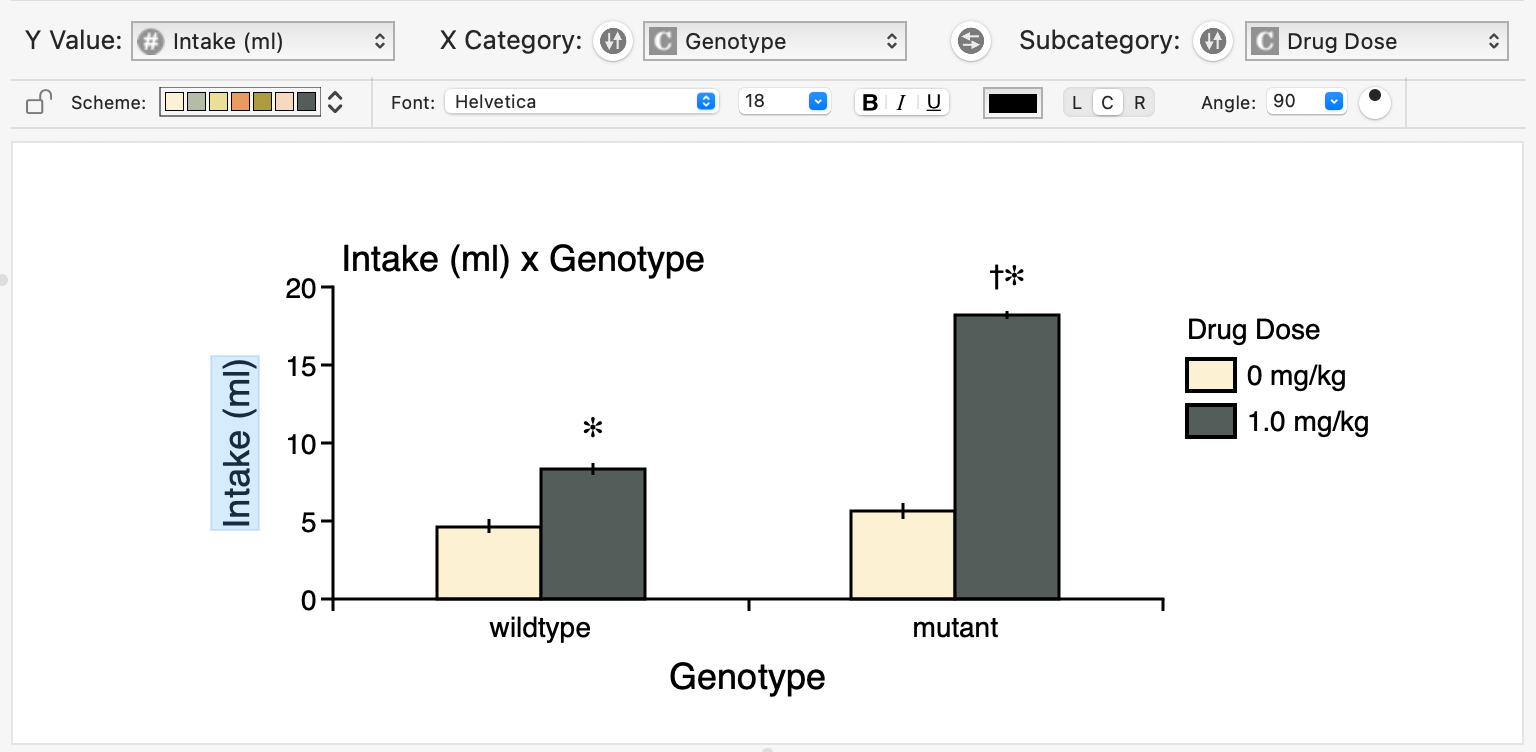
The format of text elements (such as the graph title, or axis labels, or tick labels) can be changed by clicking on a text element and selecting the attributes from the formatting bar: typeface ("Font"), font size, style (bold, italic or underline), color and justification relative to the graph box. You can also rotate the text to draw at an angle.
Note that to be consistent, changing the font typeface of one element changes the typeface of all elements (eg all the labels will be in Helvetica, or in Times New Roman).
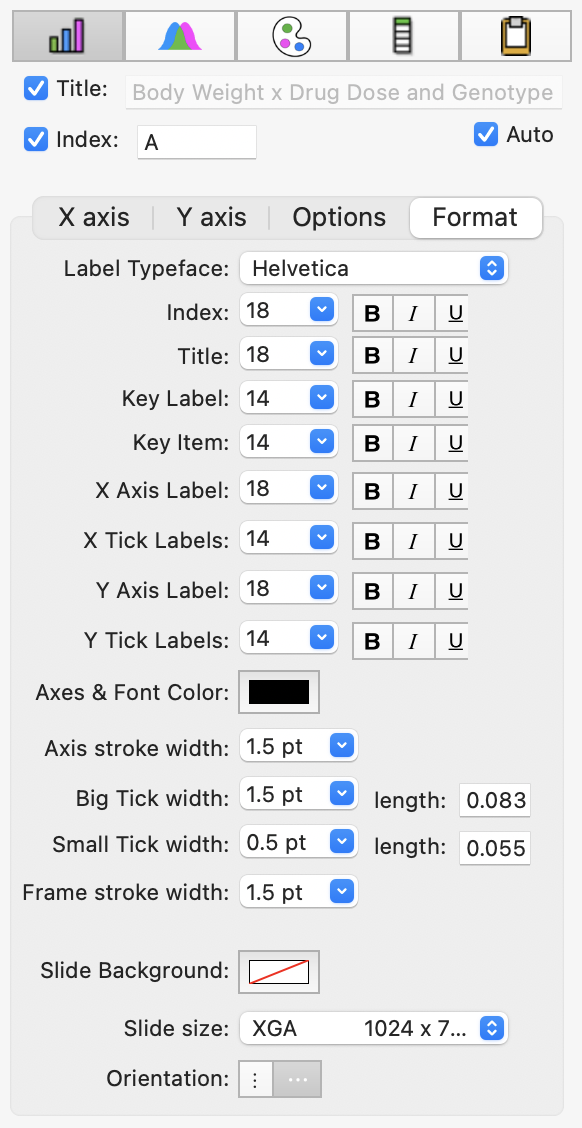
You can also change the font format of the graph elements and the axis stroke color and width using the Inspector->Graph->Format panel.