How to Show all Individual Points on a Graph
- add some text on how to control display of mean as line vs. bar
- also works for line graphs:
via Menus
Select the menu item "Graph" -> "Show Individual Points"
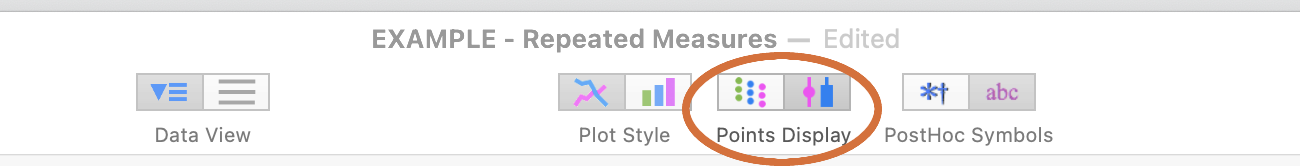
via Tool Bar
Click on the "Pts/Means" toggle button in the Toolbar.