How to Resize the Width of Bars
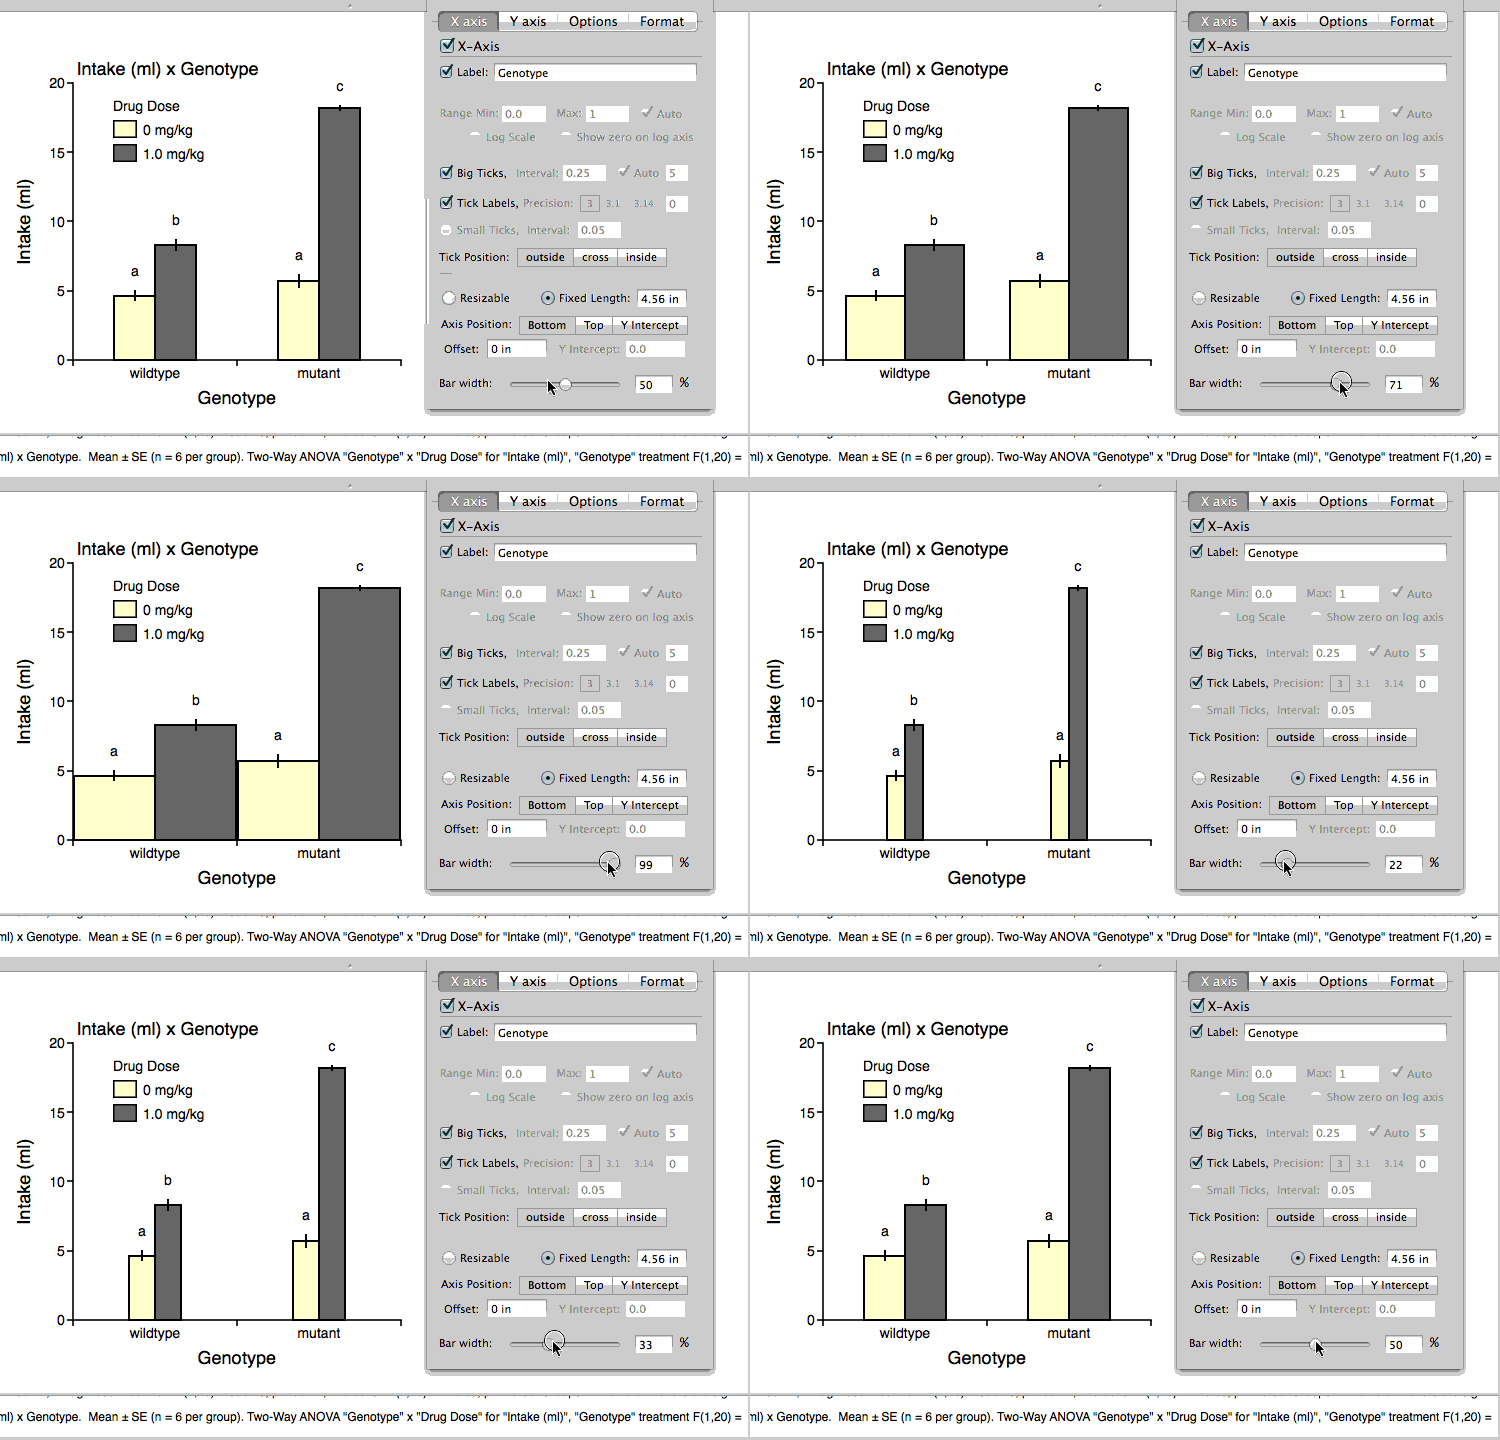
The width of bars is set as a percentage of the overall width of the category divisions along the X-axis. So, if the bar width is set to 50%, then the bars plotted in each category division will take up 50% of the division's width. (The width is entered as a percentage so that bars scale proportionately when the overall width of the graph changes.)
For example, if the length of the X-axis is 100 pts, and there are 2 members of the X-axis category, then the X-axis is divided into 2 category divisions each of 50 pt width. If the bar width is set to 50%, and there is one bar in each division, then the one bar will be 25 pt wide. If there are 2 subcategories, and thus 2 bars in each category division, then each bar will be 12.5 pt wide.
The current bar width is applied to all graphs in the file for a consistent look.
via Format Bar
Select any bar in the graph, either by clicking directly on the bar, or by selecting an item in the graph's key. This will enable the Graph tools in the Format Bar.
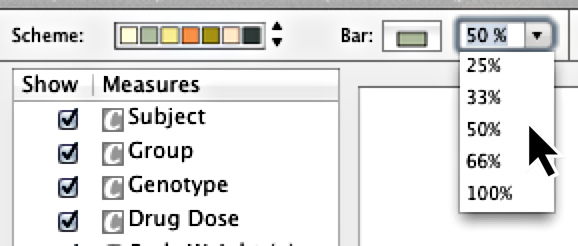
In the Bar width field, choose or enter a value from 0 to 100%:

via Inspector
In the Inspector's "Graph" pane under "X-Axis", use the "Bar width" slider at the bottom of the pane (or enter a % value directly).
